

Inside the Quant Galore Research Lab
Prediction markets, options, futures; and a few datasets we probably shouldn't talk about yet.

For the past couple of years, most of the work happening behind Quant Galore hasn’t been visible.
You see the posts, the strategy walkthroughs, and the experiments.
What you don’t see, however, is the infrastructure that sits underneath all of it:
The datasets.
The pipelines.
The event feeds.
The little internal tools that make research easier.
If you run systematic strategies for long enough, you eventually reach the same conclusion:
Most of the real work in quantitative trading has surprisingly little to do with trading.
It’s data.
Collecting it, cleaning it, structuring it, and most importantly, being able to access the datasets for tomorrow.
At some point we realized that a lot of the datasets we were building and trading off of internally might actually be useful to other researchers and traders as well.
So over the past year or so, we’ve been quietly assembling something a bit more formal:
A quantitative research data platform designed specifically for systematic trading.
Today we’re publicly opening it up for the first time.
What’s The Point?
Naturally, there are already numerous reputable data providers. For instance, when it comes to price data, Massive (formerly Polygon.io) has been our top and sole provider for years and we have no plan on changing that.
However, there are very few datasets available that sit on that second layer.
The second layer of what you do after you get the price data.
You start asking questions like:
Which assets are most likely to move tomorrow?
Which equities actually had weekly options available at the time?
Which stocks just entered a structural regime change?
What types of routine corporate events predictably result in share price drops?
These are the kinds of questions that drive systematic trading research, but answering them usually means building datasets from scratch.
Which means writing pipelines, maintaining them, and constantly updating them so your research stays point-in-time correct and models don’t go haywire.
Over the years we built hundreds of these second-layer datasets internally.
Some of them became core parts of our daily research workflow and some of them ended up becoming the foundation for actual trading strategies:
A Quant’s Guide to Cross-Section Maxxing [Code Included]
Rank stuff, long the top, short the bottom, go home.
A Junior Quant’s Guide to Corporate Actions
There’s serious money to be made in SEC filings; the catch is, you actually have to read them.
A Junior Quant’s Guide to Time-Series Momentum
You’re not predicting the future. You’re betting yesterday keeps happening.
Those are just some of the ones we’re starting with.
Now, rather than trying to describe the platform abstractly, it’s probably easier to show you a few of the datasets themselves.
Let’s start with one of the simplest, and one we’ve actually been posting the outputs of publicly for a while:
Next-Day Movers Feed
One of the first questions we kept coming back to internally was a simple one.
If you’re trying to become cross-sectional kingpins, you inevitably start asking:
Out of thousands of equities, which ones are actually likely to do something interesting tomorrow?
Not just drift a little, but produce the kinds of moves that make systematic strategies worth running.
At first glance, you might think the answer is simple:
“Just sort stocks by implied volatility.”
But markets are rarely that cooperative, as options already price expectations.
The highest implied volatility names are often the most obvious ones: earnings events, biotech catalysts, or stocks that are already extremely chaotic.
What we really wanted to know was something slightly different:
Which equities are most likely to produce a large realized move tomorrow?
So we built a model specifically designed to search for those candidates.
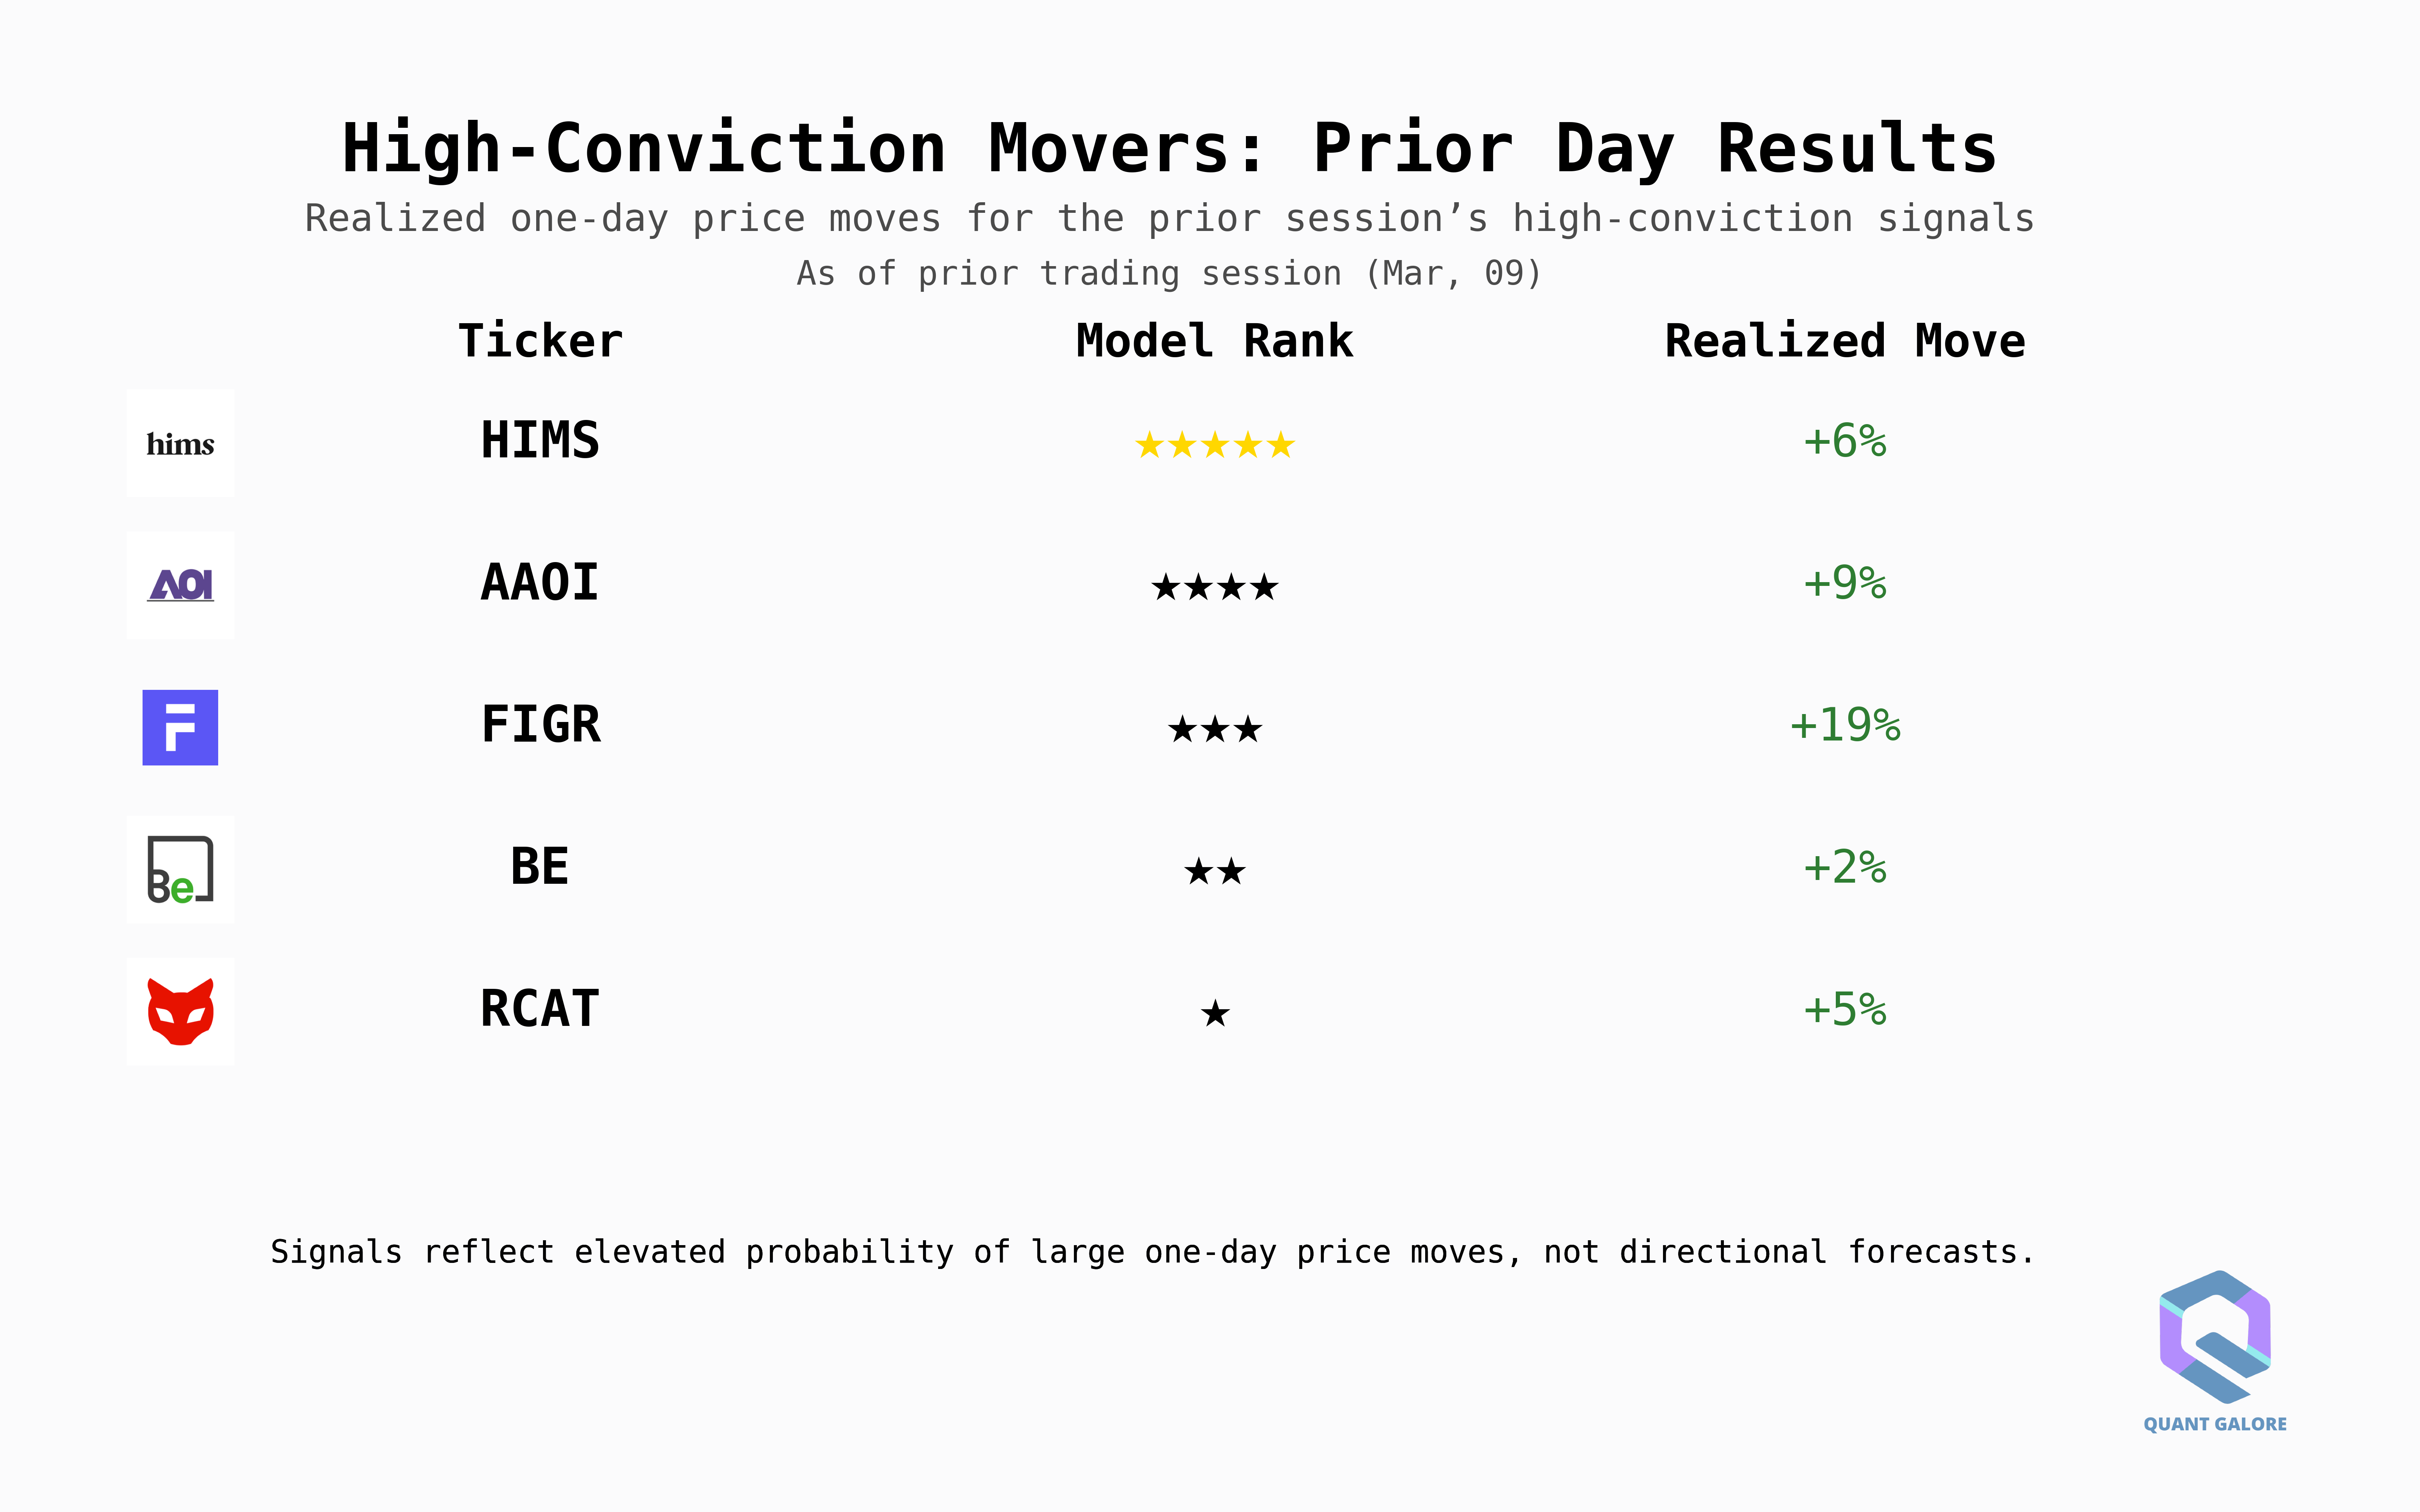
The result became what we internally call the Next-Day Movers feed.
Each trading day, the system identifies the five equities most likely to experience a large realized move the following day.
More formally, the model ranks the cross-section of liquid equities by their probability of producing large next-day realized volatility.
The actual dataset is delivered as structured data through the API, but if you visualize the daily output in a simple way, it looks something like this:
But underneath that simplicity is a fairly deep research problem.
Predicting realized volatility is one of the most interesting questions in quantitative finance.
Markets already price expected volatility into options, yet realized moves still regularly exceed expectations.
And when they do, the payoff can be dramatic.
For example:
a stock moves 20% overnight
short-dated options explode
back-term volatility surface steepens
liquidity shifts
These are the moments systematic traders live for.
Once you have a real-time and historical log of which candidates were most likely to have an underpriced large move, you can take things in many interesting directions:
What happens if you simply long shares of the top five predicted movers each day?
What happens if you buy short-dated OTM debit spreads on these names ahead of the predicted move?
What happens if you sell volatility instead; do these stocks actually move enough to justify the options pricing?
What if you trade the names relative to their sector group rather than outright?
Do short-dated straddles or strangles on these names outperform the rest of the options universe?
What happens if you combine the signal with momentum or mean-reversion features?
There are dozens of ways you could approach it.
But the point isn’t a single strategy, it’s that once you have a daily cross-section of extreme volatility candidates, delivered both historically and in real-time, an entire research surface opens up.
What Else Is In The Lab?
Over time we ended up building dozens of datasets like this: some focused on volatility, some on corporate events, and others on the structural plumbing of markets themselves.
A few of the ones already available through Alphanume include:
Historical Optionable Universe
A full point-in-time record of which equities actually had listed options on a given date.
This may sound simple and boring, but it’s the bedrock of almost every serious strategy we run.
Even better, the dataset tracks which tickers had weekly options available, allowing you to construct realistic short-dated options universes going back nearly a decade: it’s how we were able to validate our long-running momentum strategy.
Dilution & Corporate Offering Events
Share dilution is one of the most consistent sources of downward price pressure in small and mid-cap equities.
New shares enter the market, supply increases, and prices often adjust accordingly.
The problem is that the signals showing when dilution is happening are buried inside long, messy regulatory filings. Anyone who has tried to trade these events systematically quickly discovers that the real challenge isn’t the idea: it’s the data.
Filings arrive as dense legal documents, often hundreds of pages long, with the relevant information scattered across paragraphs of boilerplate language.
This dataset processes those filings into structured, machine-readable events, continuously scanning new filings as they appear.
Instead of dumping raw documents, the pipeline identifies dilution-related filings, extracts the relevant information, and timestamps the events so they can be used in point-in-time research.
The result is a clean feed of dilution and offering events that researchers can plug directly into systematic workflows.
Rather than reading filings manually, you can focus on testing questions like:
How do equities behave in the days surrounding dilution announcements?
Do certain types of offerings produce more persistent price pressure?
Are there cross-sectional opportunities around newly announced share supply?
In other words, the dataset turns an unstructured regulatory firehose into something that can actually be tested.
Another dataset we rely on heavily is the S&P 500 Risk Regime endpoint.
Short-term strategies often look great in isolation, but many of them quietly depend on the broader market environment.
Some strategies work well during stable periods of low volatility, others thrive during chaotic regimes where large realized moves increase and cluster.
The problem is that identifying those regimes consistently, and doing so point-in-time, is harder than it sounds.
This endpoint provides a simple solution.
Each trading day, the system classifies the market into a binary risk regime (1 or 0) representing the broader market environment.
Because the output is binary, it’s extremely easy to test as a filter, feature, or overlay.
Despite that simplicity, the signal goes back to 2011, giving researchers and traders more than a decade of regime data to test against.
With this data, one might explore questions like:
How do short-dated options strategies behave across different regimes?
Does a 0-DTE volatility selling strategy perform better when the regime signal is favorable?
Do momentum strategies improve when filtered by regime?
Does skipping trades during unfavorable environments improve drawdown characteristics?
In other words, instead of trying to manually determine whether the market environment is cooperative, the dataset gives you a direct signal you can plug into a strategy immediately.
Where This Is Going
Those are just a few of the datasets currently available, but in many ways, this is just the starting point.
The goal behind Alphanume isn’t simply to release a handful of interesting datasets; it’s to continue our day 1 mission:
Extracting every edge we can from every market we can get our hands on.
Equities are only one corner of the market ecosystem, but over the coming weeks, we’ll be aggressively expanding into prediction markets, futures, options, and crypto perpetual futures.
All held to the same standard:
If it can’t be used profitably, it shouldn’t exist.
Over the past few weeks, a number of researchers and traders have started using the platform, and your feedback has been incredibly helpful in shaping what we focus on next.
In many ways, that’s exactly how we want Alphanume to evolve: through smart, curious quants putting the datasets to work, stress-testing them, breaking things, and pushing us toward what actually matters.
And if you’re reading Quant Galore, there’s a good chance you’re exactly the kind of researcher we had in mind when building it.
Founding Researchers
To support the continued development of the platform, we’re opening a small number of Founding Researcher seats.
The idea is simple.
Rather than quietly building everything behind closed doors, we’d rather have a small group of sharp researchers using the datasets early, experimenting with them, and helping shape where the platform goes next.
If you’ve been reading Quant Galore for a while, you already know the philosophy: build things, test them, and see what actually works in real markets.
This program is essentially an extension of that idea.
Founding Researchers receive:
• Lifetime access to the full Alphanume dataset library
• Access to all future datasets as the platform expands
• Full API access for research and strategy development
• Early access to experimental datasets as they are released
• The ability to provide feedback that directly influences what we build next
The goal isn’t to create another passive data subscription, but to build a research environment where new datasets are constantly being tested, refined, and expanded into new markets.
Founding Researcher Access
For those interested in joining early, we created a small Founding Researcher program:
$499 (one-time)
We’re limiting this first round to just 20 researchers.
Once those seats are filled, the platform will move to a more traditional pricing structure as the dataset library continues to expand.
If you’re interested in exploring the datasets, building strategies on top of them, and helping shape where the platform goes next, you can learn more here:
Closing Thoughts
Quant Galore was never meant to be a place where we just run backtests forever.
The goal has always been to actually engage with markets: to experiment, to take real risks, and to see which ideas survive outside of a spreadsheet.
Alphanume is simply the natural next step in that process.
Now that we control the entire dataset infrastructure ourselves, we can get our hands dirty targeting the kinds of edges that larger institutions often can’t (or won’t) bother pursuing.
This allows us to stay fast, focused, and most importantly, ruthless, about hunting for new edges in markets.
Not an “interesting” Kaggle dataset that disappears in six months, but real pipelines, real research infrastructure, and a constant stream of new experiments across markets.
Quant Galore started as one person who was obsessed with systematic trading and wanted to become the best researcher possible.
Over time, we’ve grown into a community and network of incredibly smart and plucky people exploring strategies, deploying real capital, and pushing deeper into how markets actually work.
Alphanume is simply the next stage of that evolution.
A small, ruthless quant lab with much better tools.
Thank you for continuing to be part of the journey.
And as always,
Good luck, and happy trading. 🫡🫡