A Junior Quant's Guide to Corporate Actions
There’s serious money to be made in SEC filings; the catch is, you actually have to read them.
To quickly bring you up to speed: we have fallen in love with short selling.
Once we beat the constraints of most retail brokers and figured out how to short virtually anything we wanted, we launched a blitzkrieg to explore what strategies we could build on this newfound access.
But this time, we knew better than to take a raw data-hacking approach.
When developing trading strategies, it’s essential to begin with a plausible, baseline rationale for why a price move might occur in the first place.
So before touching a single row of data, we asked ourselves:
“What known events result in predictably lower returns?“
Eventually, we landed on one of the most reliable drivers of large price moves: corporate actions.
Corporate actions are just the umbrella term for all events a company reports:
Earnings
Share splits
Dividends
Dilution events 😏
Management changes
What makes these events especially attractive is that they occur on defined dates, which makes applying a systematic strategy intuitive; for example, “short for n days after the event on date t.”
Now, in this business, most ideas go nowhere.
So we live by a fail-fast operandi:
data collection → crude backtest → small-scale prod.
Once we formed a baseline theory around a particular corporate event, we ran a simple simulation and then jumped straight into production to see what the real-world results looked like.
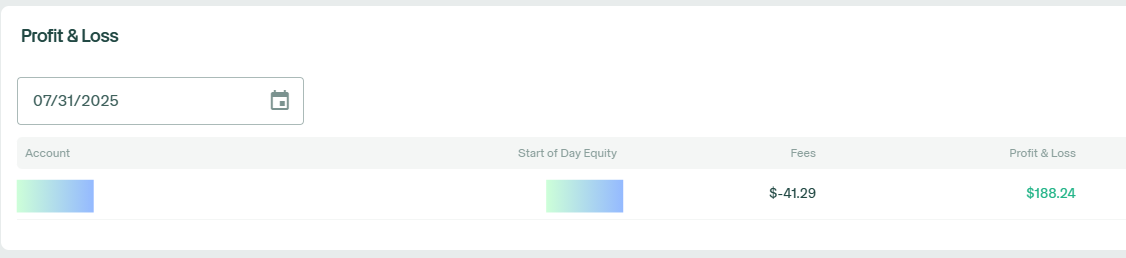
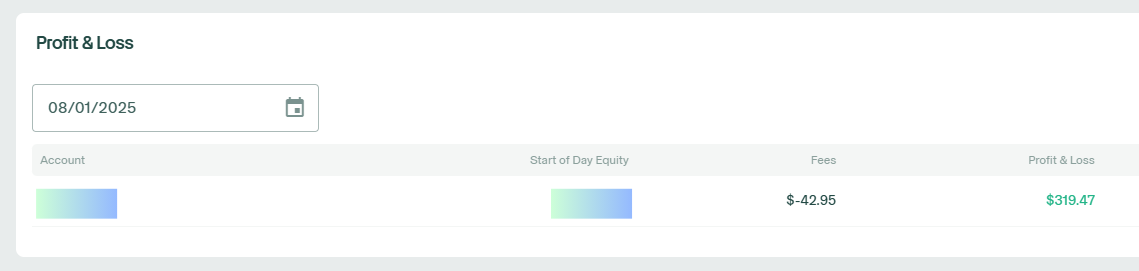
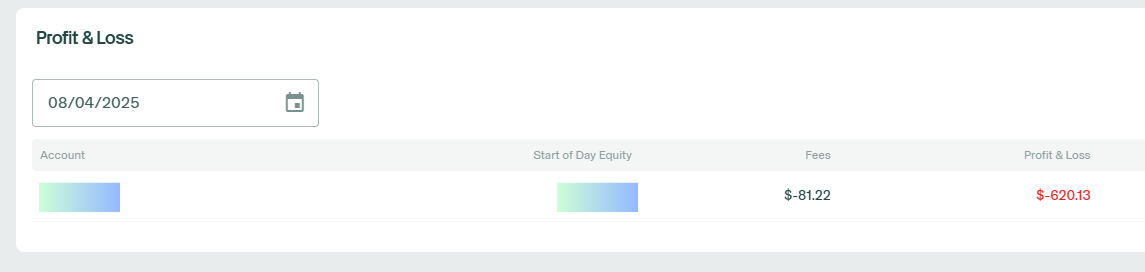
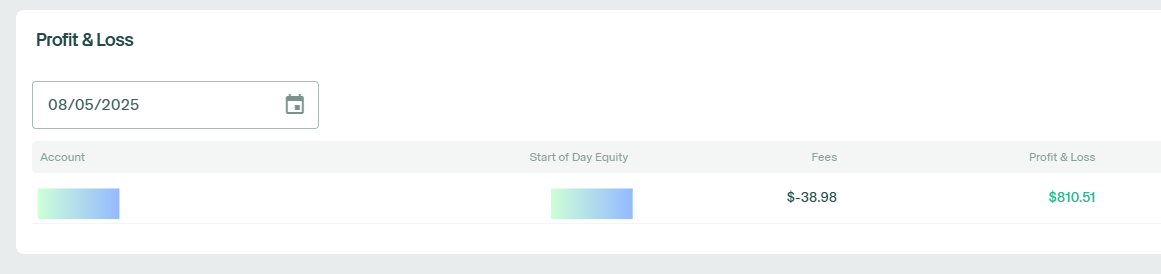
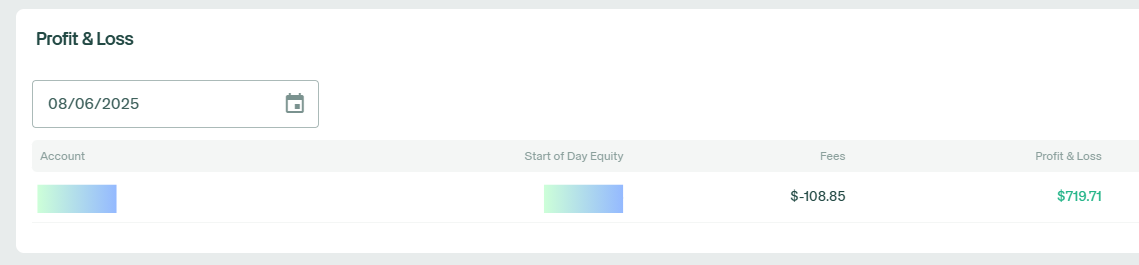
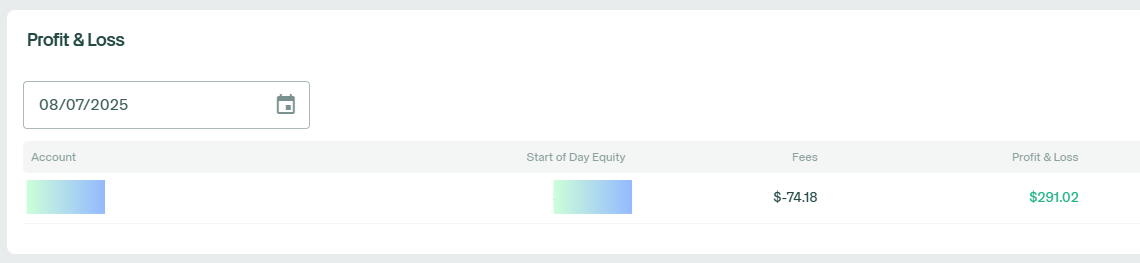
To our pleasure, this started off a sequence of extremely profitable trading, as briefed below (apologies for formatting):
Now, this corner of the market — event-driven short selling — has legitimate alpha and capacity, but there are some serious nuances that you need to know to understand why the edge exists.
So today, we’re walking you through the full, real-world process of turning these murky filings into actionable trades: from ideation and data collection, to simulation, and ultimately, live capital deployment.
As always, we’ll share the code and tools so you can replicate (or debunk) everything for yourself.
Without further ado, let’s get right into it.
You’ve Gotta Read The Filings, Man.
Before we dive into the deep end, let’s start with the basics.
Our objective is to expand our reach in the short-selling business.
We want to know when a company does something bad and place ourselves in front of the inevitable.
So, we asked ourselves:
“What kinds of events are considered “bad” by the market?”
Well, for one, take dilutive events.
Here’s how it works:
Company A starts with 10 shares, each priced at $10 → Market cap = $100.
The company issues 40 new shares → Total shares = 50.
No new value is created → Market cap still = $100.
The new theoretical share price becomes $2 ($100 ÷ 50 shares).
Existing shareholders are diluted and now own a smaller % of the company.
You’ve probably seen this play out with certain meme stocks, where a huge retail-driven run-up is quickly followed by a new share offering. The company takes advantage of the inflated price to raise capital; after all, they do generate net usable cash from these offerings.
But almost invariably: companies don’t do this from positions of strength.
Dilution is often a last resort, used by companies that:
Can’t access the bond market
Operate in high-risk sectors like biotech, where cash = runway
Are trying to prolong the inevitable bankruptcy
So, at this point, we can form our first hypothesis:
If a company dilutes their shares, the forward returns post-dilution should be negative.
Given our specialized broker access to locate and short the shares, we can plausibly execute short-sales and capture those negative future returns.
Now, that we have the idea, let’s get some data.
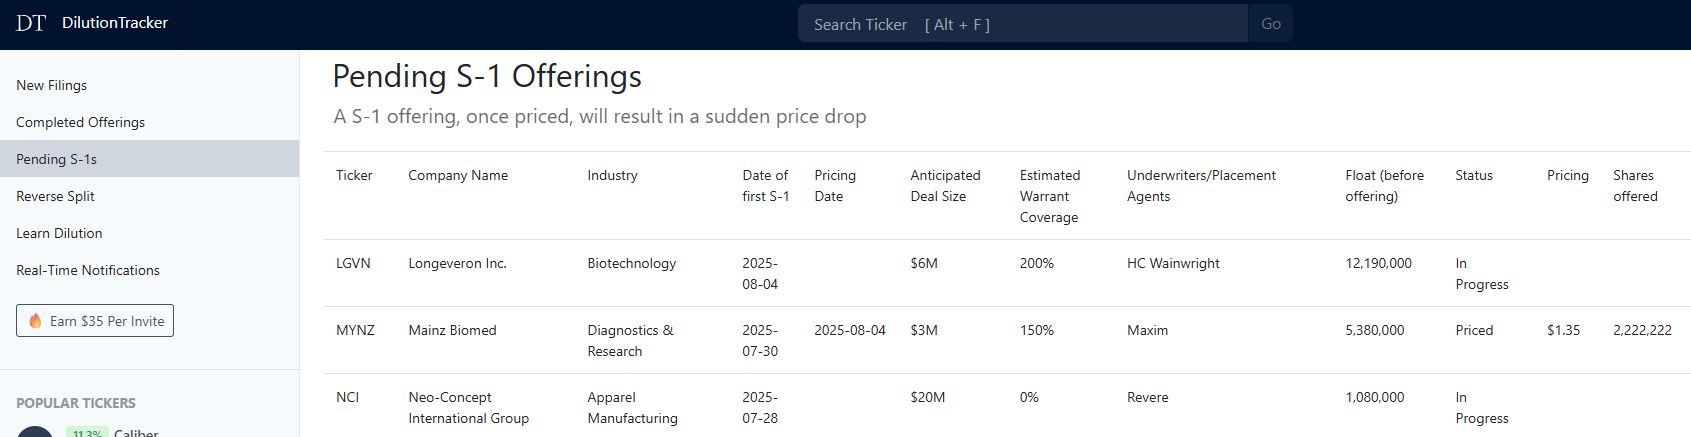
We’ll start with a dataset from DilutionTracker (no affiliation):
You see, when a company plans to dilute their shares, the price doesn’t always drop right away. It usually happens in stages, like this:
The company files a registration statement with the SEC, announcing its intent to issue new shares. This doesn’t guarantee anything, it’s just a heads-up that dilution may be coming.
S-1/A Amendment
If the offering progresses, the company submits an amended filing with updated terms regarding pricing, share count, or selling shareholders. Still, there’s no guarantee the deal goes through.
Form EFFECT
Once everything’s finalized, the SEC issues an EFFECT notice. This means the offering is now legally effective and the shares can be sold.
Once this is out, the stock price immediately drops.
Because the offering might be delayed, canceled, or have its terms amended, the market doesn’t immediately price in the dilution.
So, now that we have our target event, there are a few paths we can take to form a strategy:
(A) Build a model to predict whether the share offering will be confirmed within 30 days.
Since the price often doesn’t drop on the initial S-1 filing, we could pre-position before the EFFECT form hits, then buy back after the drop.
(B) Short the day after the initial filing and hold for 30 calendar days.
Here, we’re betting, lightly, that the offering will be priced quickly, but more importantly that the filing itself marks the company as “bad”, and thus likely to produce negative forward returns.
Having faced this juncture countless times, experience says start with option B, then if the baseline crude results are good, we can then add a refinement layer.
If the simplest version of the strategy doesn’t work, optimizing it often becomes putting lipstick on a pig.
DilutionTracker’s dataset covers all non-IPO S-1 filings for micro and small-cap stocks, so we’ll use that for our first test:
On the next trading date after a dilutive S-1 filing is made, we establish a short position at the close.
We’re not aiming for HFT speed, so we implement a realistic delay of when we’d actually be able to trade.
30 calendar days later, we buy the shares back.
Repeat.
Here’s how that basic test performed:
We’ll include the code and data below so you can replicate (or debunk) this yourself, but even in its extremely crude form, the backtest cleared the first benchmark, though with a fair amount of tail risk.
Of course, this version doesn’t fully account for real transaction costs. As we covered in our introduction to short selling, borrow costs can be tricky to model since they vary by broker. Some securities might cost 15% in interest over a month, while others (especially high-float names that have diluted repeatedly) might be closer to 1%.
With the baseline showing potential, our next step was to uncover the real constraints. So, we took it straight into production to see what would actually happen.
Losing in Prod > > > Backtesting Forever
Now, although we take a fail fast approach, it doesn’t mean we take a reckless one.
First, we needed infrastructure: accurate records of events, a reliable delivery system so we’d know exactly when they happened, and a framework for how much to risk.
We’ll spare you the boring stuff, but to start, we weren’t totally familiar with the dataset provider, so we wanted to be clever and “cut out the middleman” to get our own data directly from the SEC.
This was a nightmare.
Not every S-1 filing is dilutive.
An S-1 covers all share offerings, so that includes fresh IPOs, non-dilutive resales to insiders, sales to private investors only (PIPEs), and more.
This is raw text data where wording can vary with each separate filing, so parsing through each to determine whether or not it’s actually dilutive is another ball-game entirely:
We experimented with passing in the cleaned text to the OpenAI API, asking GPT to return a 1(0) if the filing was dilutive (or not).
This actually worked out pretty well, although sometimes GPT does things like “based on the texts and instructions, we assign a *1*” instead of just a 1 or 0. We fixed that by manually cleaning the output into strict 1s and 0s, and it proved effective.
We also experimented with featurizing the amount of times specific keywords appeared in the filing (e.g., “net proceeds”, “resale”, “PIPE”)
This was less effective as the strict regex text search missed out on things like “sum of all proceeds”, “no net proceeds”, or “re-sale”.
Eventually, we determined that for this specific approach, it’s probably best to just rely on a data provider who already has the infrastructure in place.
With that settled, here’s the core mechanism of our strategy:
We wanted to start small, so for each name that came up, we threw $1,000 at it. This is how we ran it in our historical simulation, so it’s important to execute it exactly the same way.
If there’s ever a major divergence between your historical simulation and what you actually made on that respective date, that’s one of the major calls to pause and walk through your simulation engine line-by-line to see what went wrong or what you were missing.
Now, these events happen a lot, so our portfolio is continuously expanding. Historically, we expect to be exposed to up to 20 different positions during a rolling 30 day window.
On the execution front, locating and shorting the shares has been almost suspiciously cheap and efficient:
Our average locate cost is about $0.40 per 100 shares, so it generally amounts to no more than 2% of notional exposure.
Every name we shorted was hard-to-borrow (HTB) and many had active short sale restrictions (SSR), but we got the locates within a second and executed with a limit order near the close:
In the crude backtest, we simulated just trading at the closing price. To match that in production, we went with limit-on-close (LOC) orders. This essentially sends a limit order at market close at the official-exchange closing price — the price used in the backtest.
This worked fine most of the time, but because these are fill-or-kill orders, illiquid names sometimes only partially filled. We’d then have to replace the remainder in the thinner post-market.
Additionally, there’s a cut-off time for you to cancel these orders (~5-10 mins before close). If something changes late (say, the model output flips and you no longer want to short it), you’re SOL.
Now, a 2% hurdle right off the bat is steep, but given the expected return per trade, the math still points to a net positive expected value (EV).
Trading continued as modeled, then one morning, we were awoken to a rather ominous-sounding email:
Upon receiving this alert, a sane organization would call their broker and ask for further clarification, but we just decided to just see what would happen if we left the position open.
Thankfully, nothing did.
Why this happened goes back to the mechanics of how short sales actually settle:
When you short a stock, your broker borrows the shares from another account (often at a different brokerage) and delivers them to the buyer at settlement, now T+1 (one business day after the trade date).
If, for whatever reason, those shares can’t be delivered in time: maybe the lender recalls them, maybe the locate fell through, or maybe the clearing firm (in this case Apex) can’t actually source them, you get what’s called a fail to deliver.
Regulations allow a limited grace period, called the “days to deliver” window. If the fail isn’t resolved within that period, the clearing firm is obligated to close out the position by purchasing shares in the open market to settle the trade (a forced buy-in).
As interesting as that is, it’s a perfect example of why we go with a fail fast, but structured approach.
We could’ve spent another 2 weeks simulating and tweaking this, but unless we actually interacted with markets and got the real-world feedback, we’d never have uncovered that risk or the mechanics behind it.
Disclaimer: This is our exact mechanism, but we aren’t using S-1’s as the event. Believe it or not, it’s not even close to the most profitable filing event, so naturally, we have to keep some things up our sleeves.
Final Thoughts
From day one, our goal was to eventually get good enough at this quantitative trading business that we would be able to deploy multiple uncorrelated strategies and compound capital as a lucrative business.
After years of trial and error, we have appeared to find our footing in the strange land of short selling.
Of course, in a year from now we might get slapped in the face, but for now at least, we are compounding capital across multiple uncorrelated strategies.
As great as that is, we’ve ventured beyond just solely lifting markets on momentum and have moved into somewhat darker territory.
At this point, a philosophical person might see two schools of thought:
We are adding value to the market by improving price discovery and helping investors get a true idea of the fair value of an asset.
The share prices are going to go down anyway, our added volume just speeds up the discovery process and we are being rewarded for the service.
We are extracting value from the market by accelerating price declines which leaves companies with less capital, potentially leading to layoffs and reduced business output.
If we didn’t short these shares, the stability of the prices could theoretically boost investor confidence and offer the company future sources of capital to improve operations and add value to the world.
Perhaps these aren’t mutually exclusive.
Tangent aside, the moral is simple:
There’s serious money to be made on the short selling side, especially around corporate actions.
All you need to do is get hooked up with a broker that lets you short what you need, then that unlocks your first door. A little more elbow grease for some stable, replicable infra, then you’re in business.
Code
The repository below includes a csv file of the dilutive events from DilutionTracker (already free and public) and the basic backtesting logic used in the example strategy.
Navigate to the Event Driven Short Selling repository
Download the files (make sure both files are saved in the same folder):
dilution-tracker.csv
s1-dilution-strategy.py
Run the Python script; it works out of the box, and you're free to modify any part of it as you see fit.
If you end up doing something really interesting and end up putting some $ on the line, give us a shout 😉
Reminder: This replicates the example S-1 strategy and process above, but we are using a different filing type in production.
Good luck, and happy trading. 🫡🫡