

A Junior Quant's Guide to Chasing Vol and Shorting Stocks
700% financing rates never stopped car dealers, so it damn sure won’t stop us.

Outside of capturing vague, esoteric edges, much of quantitative trading boils down to one thing — buying low and selling high.
Take our momentum strategy, for instance:
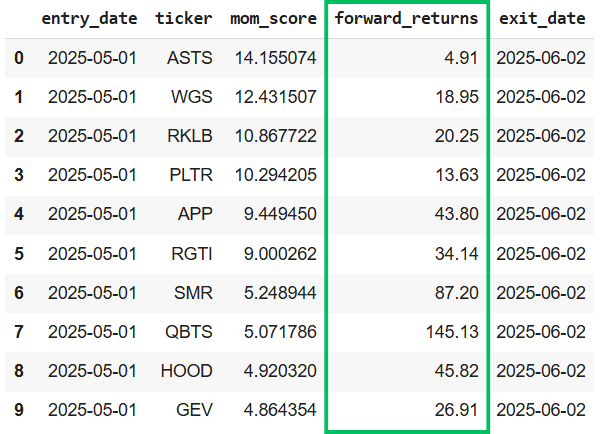
Each month, we screen the most actively traded, optionable stocks and rank them using a 12-1 historical lookback combined with a custom momentum metric.
We then buy the 10 highest-ranked names and rebalance the portfolio monthly.
Here’s a snapshot of this month’s live production performance as of the time of writing:
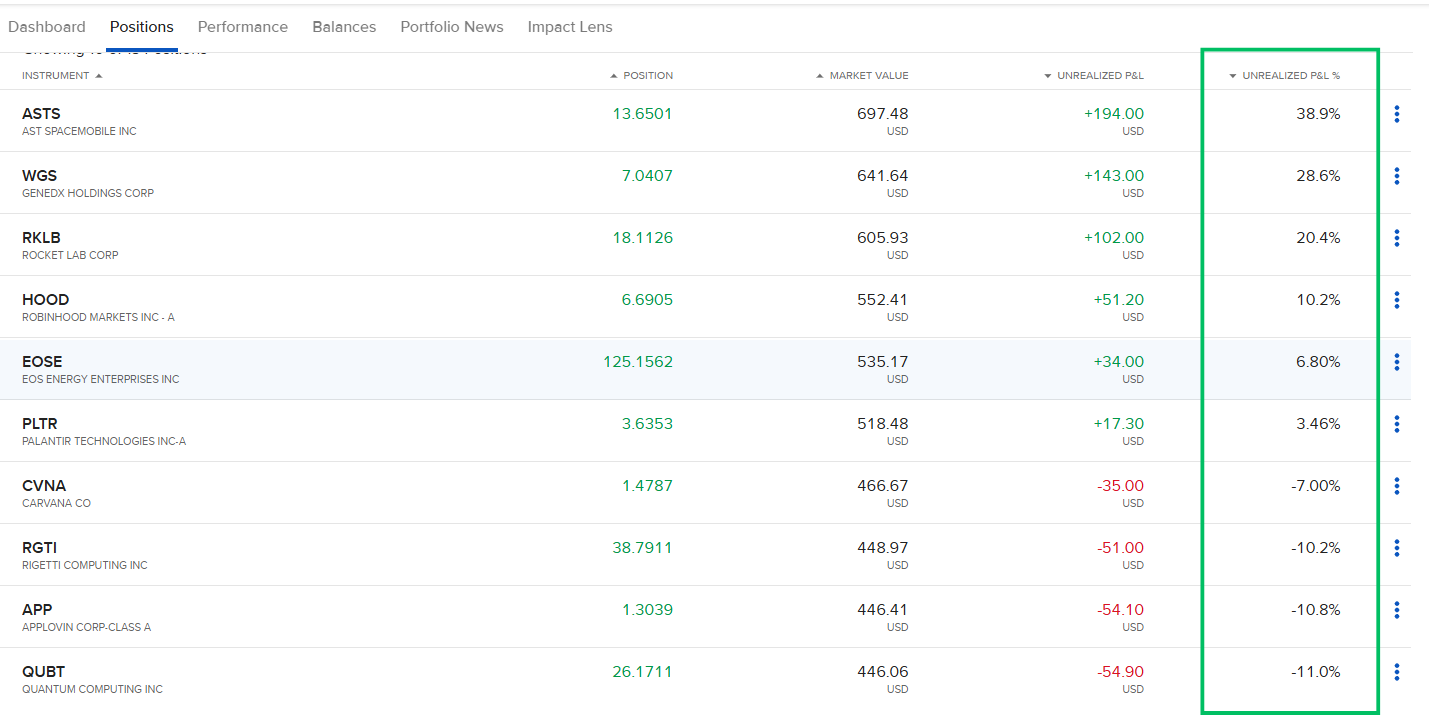
This was our first month in production, partially fueled by a bit of FOMO after seeing how strong the previous month’s performance was (+40%):
We recommend taking a look at our full breakdown of the strategy, and if you’re really ambitious, give our GitHub repository a look so you can run it yourself:

Time-Series Momentum GitHub Repository
We’ll be posting another update soon with new insights on execution, basket selection, and more. But for now, we’ve got some more urgent matters to cover.
So, although we’re running an active strategy that’s generating solid returns in a scalable way, we have to confront an uncomfortable truth:
If the broader market goes down, this strategy is dead.
Sure, the basket is relatively uncorrelated, diversified across sectors, and driven by idiosyncratic flows; but in the event of a systemic shock or broad market drawdown, correlations go to one and momentum names tend to fall the fastest and hardest.
At the end of the day, while we are capturing the momentum effect, we’re also essentially just long very high beta. When the market’s strong, we can significantly outperform the S&P; but when things turn south, drawdowns of 50% or more are well within reason.
Once we acknowledge this existential risk, the natural impulse of any trader is to start designing some complex hedging structure — a big protective payout if things go south.
But we’re not going down that road.
Hedging is generally negative expected value (EV) and option prices are pretty efficient, so we’ll often be accepting perpetual underperformance in the good times for only marginal relief in the bad.
Instead, we’d rather take a page from the multi-strategy legends: rather than hedge, diversify.
Specifically, by introducing a strategy that operates on the other side of the equation: short selling.
When we started this experiment, we had never placed a single short trade at scale. In short time, we were pulled into a rich and surprisingly profitable world filled with locates, borrow fees, and volatility-chasing.
The short selling game is massively underappreciated and with a bit of effort, far more accessible than you might think.
We won’t keep you waiting any longer; so, without further ado, let’s dive in.
A Primer on Short Gambling
To begin, we were essentially starting off with a totally blank page:
“Okay, we want to build a strategy that revolves around short selling — now what?”
Our first instinct was to just reverse our existing momentum strategy: if we're already buying the winners, why not just short the losers?
After some testing, it became clear there was a major obstacle:
In the world of short selling, borrow fees are everything.
Since this can get confusing quickly, let’s start with a high-level overview of how shorting actually works:
You identify a stock to short.
Let’s say your momentum system flags Stock XYZ as a loser. You’re running the trade through your brokerage account at Interactive Brokers.IBKR checks if shares are available to borrow.
You can’t short XYZ if there are no shares going around, so IBKR looks across its network of counterparties to locate inventory.Goldman Sachs has the shares.
Goldman is holding 2 million shares of XYZ in custody for its clients — long-term holders like pensions or index funds.Goldman lends the shares to IBKR.
Goldman agrees to lend out the shares (charging a borrow fee), and IBKR passes them along to you, with a markup on top.You short the shares.
With borrow confirmed, IBKR lets you sell the shares into the open market. You’re now short XYZ and your PnL rises if XYZ drops.***You start paying borrow fees daily.***
Here’s the kicker: borrow isn’t free. If XYZ is “hard to borrow” (low inventory), your costs might run 20%, 100%, even 900% annualized!
Interestingly, this entire mechanic — lending out long-held shares for short sellers — is a major business, reliably bringing in billions a year for firms like Goldman and Vanguard. Their “edge” is that they’re not taking market risk by buying shares and lending them out, but rather the original holders (pensions, index funds, clients) still keep the shares they own, Goldman just facilitates the borrow.
Nevertheless, the biggest challenge with short selling is the borrow fee that’s charged daily.
You see, if a stock is commonly known to be garbage with no future, you likely won’t be the only person trying to short it. If your ideal holding period is 1 month (like in our long momentum strategy) and the borrow fee is 300% annualized, you’re going to have to pay nearly 25% of your size:
Daily interest = Annualized rate / 365 days = 300 /365 = ~0.82%
Monthly interest = Daily interest * 30 days = 0.82 * 30 = ~25%
However, this need not be the end of our journey.
If the borrow fees are on the higher end, like 300% — that amounts to a daily interest charge of ~0.82%. By shortening our trade horizon from 30 days to just 1 day, the breakeven point shifts — instead of needing a 25% move to be profitable, we only need a 1% move to cover the cost of the borrow.
At that point, borrow fees become a much more manageable hurdle.
So, all we have to do is get exposure to the worst stocks that are likeliest to have the largest 1-day volatilities so that we can beat borrowing costs — easy, right?
Maybe not. But we wouldn’t have made it this far in this business without the willingness to at least try.
Just Predict Vol, Bro. It’s Easy.
Luckily for us, predicting volatility is a lot easier than predicting direction.
So, to begin, let’s re-visit a pretty well-known phenomenon:
Volatility tends to cluster.
In other words, if the past n days were highly volatile, the next n days are likely to be volatile as well.
There are numerous studies on the subject, in fact, it’s one of the earliest hallmark observations in quantitative finance; but you don’t need a research paper to see it in action, just look at any chart of the VIX (implied volatility):

So, if we know that the best predictor of future volatility is recent volatility, we can start by building a simple ranking metric:
1-day historical volatility
In other words, if a stock moved 50% yesterday, can we reasonably expect it to move at least 1% today — enough to cover the borrow fee?
Testing this is relatively trivial, but first we need to define our investable universe.
To avoid survivorship bias, we construct point-in-time universes that reflect which stocks were actively tradable at each moment in history. This way, we won’t foolishly make ourselves look like geniuses for doing things like buying NVDA back when it didn’t even have $1,000 in average daily volume.
Now, unlike our long momentum strategy, we’re not targeting the highest-quality, most liquid names. Instead, we want stocks that are just liquid enough to short — enough for your broker to locate shares, but sketchy enough to avoid just replicating levered beta all over again.
So, we’re going to loosen our criteria from those with the deepest options liquidity to those that had at least $5m in average daily trading volume. This instantly gives us a pool of ~2,500+ eligible stocks to choose from each day.
With this survivorship-bias-free universe in place, we sort by which stocks had the highest 1-day volatility and then observe what volatility looked like the following day.
Here’s a few recent, notable examples:

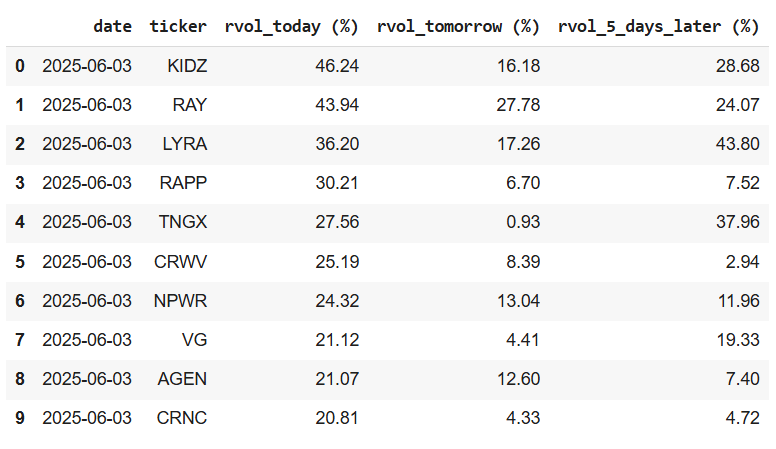
As you can see, these names aren’t exactly household favorites (KIDZ? GORO?), but this simple heuristic reliably surfaces stocks with high short-term realized volatility.
Now, of course, realized volatility != direction, so although we can reasonably conclude that a stock will have high realized volatility as soon as tomorrow, we’re still in the dark as to whether it’ll go up or down.
In order to make this work, we’re going to need some way of getting an angle on direction. This is the early stage of the research process, so this is the part where you just toss around ideas and see what sticks.
Challenge: You have a way of knowing which stocks are going to double overnight, you just need a way to systematically get the direction right, at least 51% of the time.
How will you do it?
Take some time.

Well, one idea goes back to what we already know about the SPX-VIX complex — higher implied volatility tends to be associated with lower forward returns:

So, what if we applied that same logic here? If we know a stock is about to experience elevated volatility, why not assume that volatility skews to the downside?
With that idea in mind, we can define a simple strategy:
Keep reading with a 7-day free trial
Subscribe to The Quant's Playbook to keep reading this post and get 7 days of free access to the full post archives.