
A Junior Quant's Guide to Ultra-Leveraged Trading
Bringing civility to the land of 100x leveraged products.

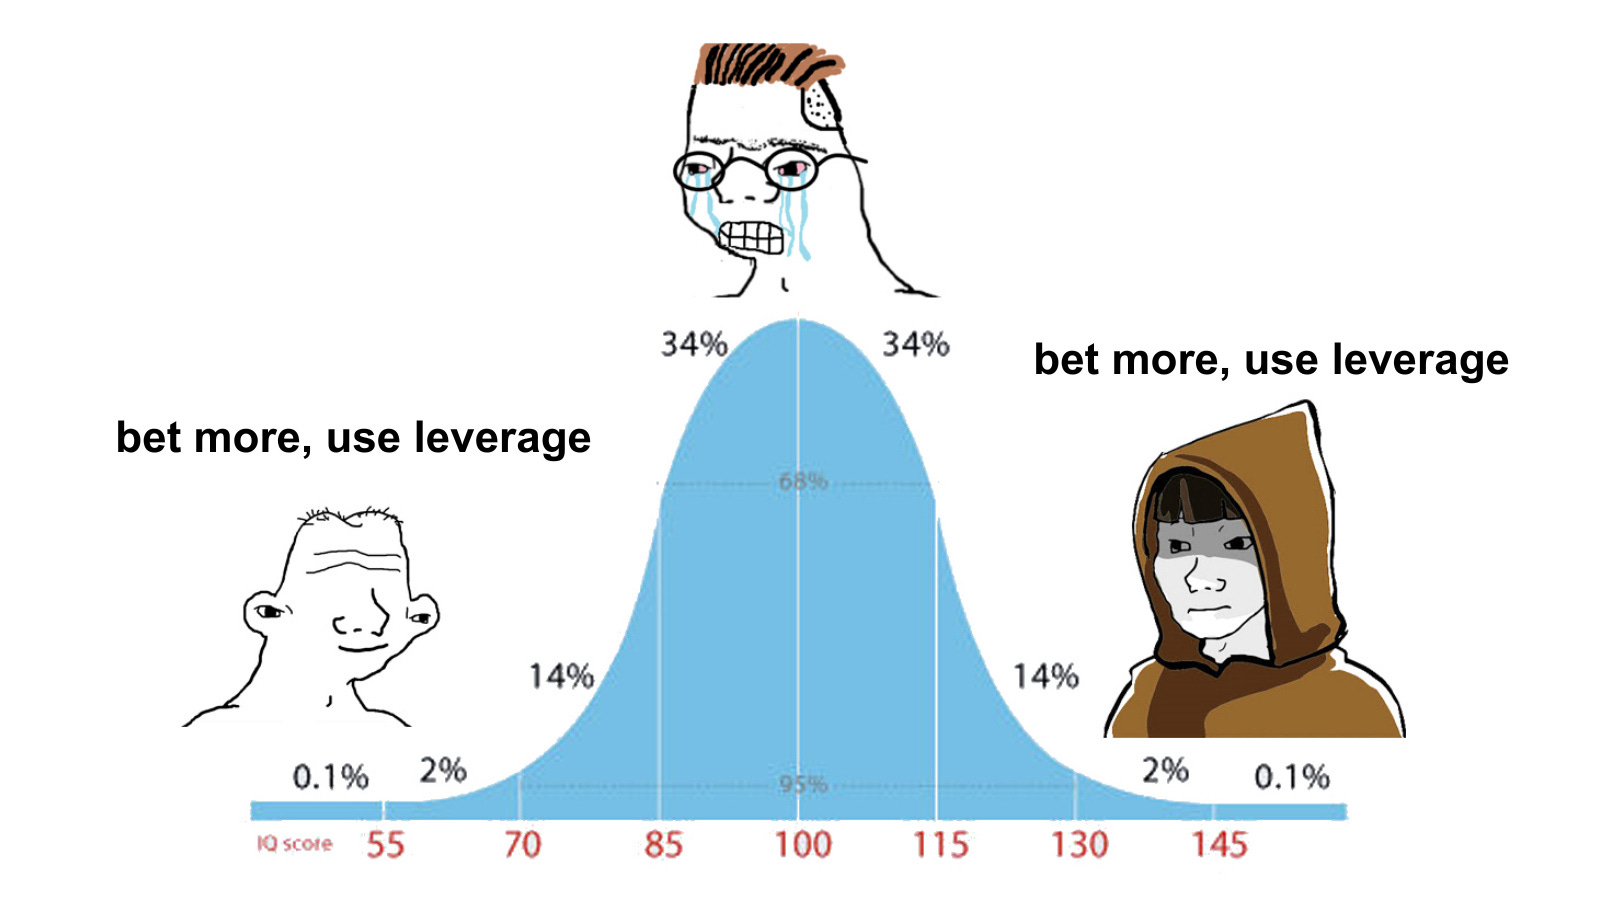
“There are only three ways a smart person can go broke: liquor, ladies and leverage.”
If you’re a quantitative trader or even just a general market participant, we all know the goal is to make money. However, some of us like markets so much that we earnestly try to make a business of it. At that point, however, it’s not just about making a profit — it’s about making enough profit — enough for employees, enough for better data, enough for better tools.
Now, a well-known joke in markets is that the best way to make $1m is to start with $2m — otherwise, your other option is to just chase low-probability, high-payoff scenarios.
Although we aren’t seen-it-all grizzled veterans, we’re not exactly fresh, naive tourists to pursue such a foolish approach.
So, this presents a problem that every prospective fund manager is eventually faced with:
“If we have a solid way of getting reasonable returns with low volatility, how can we source the highest amount of capital at the lowest cost?”
In traditional finance, we can get there a few ways:
Stocks: If you’re low-capital retail, you’re maxed out at 2x leverage for stocks under Regulation-T margin. Once you can put up a bit more capital, you’re then offered Portfolio Margin, which stretches things a bit further to 6-7x.
If you’re an institution (proprietary firm, hedge fund), you would go through what’s known as a prime broker (PB). The leveraged offered by a PB is about the same as portfolio margin but there are more bespoke services offered (e.g., short share locates).
Bonds: Even at a basic retail level, you can lever up 30x when purchasing treasury bonds. So, within a single day, a $30,000 Charles Schwab account can accumulate a $900,000 treasury bond position:
While attractive, no one actually uses this for trading since the margin rate offered by a broker (e.g., 12%) is generally a lot higher than the yield on any treasury (e.g., 4%).
Additionally, if you wanted to do something like buying a big bond position before a payment and only accruing 1-day of margin interest, you’d still be paying the “dirty price” of the bond which already factors in accrued interest.
Futures: Sure, futures definitely serve a real purpose for hedgers, insurers and whatnot, but really though — these are products basically designed for leveraged gambling.
If a trader decides to go with a discount futures broker, they may only need to post $500 of collateral for an S&P 500 futures contract (/ES). For reference, the notional value of an ES contract is 50 x index_price, so as of writing, that represents a notional value of ~$285k — effectively a 570x leverage rate.
Now, a hard lesson we learned from our 0-DTE days is that a product itself is not inherently an edge or a strategy — it may have very enticing features, but at the end of the day — it’s just an instrument. Whether or not it’s an effective instrument is entirely dependent on the specific underlying view you’re trying to capture.
So, now that we have a possible idea of how we can lever our capital up, we need to identify appropriate ways to use it.
We know better than to chase volatile, big payoffs, so our desired risk/return profile is bond-like volatility, with equity-like upside. The absolute percent returns might be small, but if we lever it up enough, the absolute dollar values should make it a worthwhile endeavor.
With that goal in mind, we set out to search for which kinds of strategies fit the bill and eventually, we landed on a pod-shop favorite:
Long-Short Relative Value
One of the first hedge fund strategies and ostensibly the most simple — you long one asset and short another — the offsetting PnLs roughly balance each other out for market neutrality.
You go from predicting the outright performance of any 1 asset to instead predicting the relative performance compared to another asset.
The predictions don’t even need to be something complex and proprietary, it can be common-sense stuff like estimating that large caps will fare better than small caps or that Bitcoin will hold its value better than a meme-coin.
Now, like most things — the nuance is where it gets tricky.
To see how, let’s take a look at a reasonable long-short trade:
Starting Theory: The S&P 500 Index will perform better than the Russell 2000 Index.
We’re stepping a bit out of our depth into the equity fundamental world, but it’s a concept that makes sense from a big-picture view — all theoretical academic factors aside; who will fare the best in the future U.S. economy? — the FAANG’s and the Berkshire Hathaway’s — or — the deep south egg-packaging firms and small, single-drug pharmaceutical companies?
Now, again, we’re not making an explicit directional view on “the market” itself, we’re just betting on the relative performance
If the market is positive, the S&P may go up 10% and R2K might only go up 3%, that 7% spread is our theoretical profit.
If the market is negative, the S&P may go down 10%, but R2K might be down 17%, that 7% spread is our theoretical profit.
Of course, this assumes that both assets remain correlated. If some rogue leader signs a new law that all S&P 500 members will be taxed at a 75% rate, but R2K members get a cut to 5% — the trade is over.
So, it’s not totally riskless, but realistically the correlation is likely to stick since both are driven by the same fundamental macro drivers. It’s a bit less quantitative, a bit less mathematically rigorous, but that can be all it takes to form the basis of a view.
With this being our starting point, we then run a very quick, raw test to see how this portfolio performed historically.

Just with a cursory test of the relationship, we see that even in times of distress (e.g., COVID, Russo-Ukrainian War, 2025 Trade War), the offsetting exposures balance out and the relationship generally holds.
There was a period in late 2020 to early 2021 where small caps outperformed — the consensus on why is that the small cap factor historically tends to outperform large caps immediately after recessions — Small Caps Have Been a Big Story After Recessions.
This gives us pause as, at the time of writing, there are some recessionary fears, so it’s a real risk factor to consider on a forward-looking basis — but we’re just in the experimental stage, so for now, let’s see what else we find.
Now that we have the view, we just need the right instruments. Thankfully, both the S&P 500 and the Russell 2000 have deeply liquid futures products, so all we need to do is use those instruments to systematically execute our view.
Here’s one way we might approach it:
At market open each trading day, we buy 1 /ES future and simultaneously short an equivalent-notional amount of /RTY futures.
We profit if the S&P 500 performs better than the Russell 2000 index over the course of that trading day.
At market close, we close the position.
Repeat.
Now, when doing a deeper simulation of a strategy, it is very important to be as realistic as possible. With that being a motto, here’s some of the few testing constraints:
Using NBBO (bid/ask) quote values instead of OHLCV values
For liquid products, OHLCV is honestly roughly fine enough, but as you get into more niche offerings, having to cross the bid/ask spread can be a night-and-day difference than just assuming you’d have been able to trade at the last price.
Using a real fee model
Assuming costless transactions is another major mistake, so it’s best to take the actual fees your broker charges (it’s always on their website) and simulate using the exact, real costs you’d incur.
So, with those constraints in mind, let’s see how the approach fared:

As demonstrated, the curve of the intraday version is about similar to that of just holding the long/short portfolio indefinitely.
Roughly similar, but it’s evident that the continuous rebalancing and daily accrual of transaction costs act as a draw on returns.
Further, going with an equal-dollar weighted amount introduces a new problem — beta mismatching.
Assuming a rolling 90-day beta of 1.35 for the Russell 2000, we assume that for every 1% the S&P 500 moves, The R2K will move by ~1.35%. Now, over time this is fine as the larger losses add up resulting in eventual R2K underperformance, but on an intraday basis, this means that we often take losses on days where the overall market goes up (e.g., S&P up 0.7% today, R2K up 0.95%), simply because R2K is correlated, but more volatile.
There are ways to beta-weight the portfolio so that the beta is theoretically net 0, but futures are only available in whole units, so we’re always going to be a little under or over exposed to beta.
Now, this can be handled by just expanding the duration of the trades, from intraday to weekly/monthly for instance. However, holding a futures position overnight, even when hedged, requires you to post the full maintenance margin of both products. Yes, even at full maintenance margin, you’re still levered up, but it’s significantly less and represents a legitimate capital constraint.
So, this was definitely an interesting starter experiment and got us into the weeds, but now that we’ve seen the problems, we can start to innovate for solutions.
To do that, we need to look somewhere we haven’t yet.
Crypto Perpetual Futures

We’re not crypto natives, but the inspiration for this idea came from one of the relative value scenarios we pitched earlier:
“The predictions don’t even need to be something complex and proprietary, it can be common-sense stuff like estimating that large caps will fare better than small caps or that Bitcoin will hold its value better than a meme-coin.”
If we’re using a similar logic and considering Bitcoin to be the S&P 500 of crypto — the most widely recognized, widely adopted — what would be the Russell 2000?
Well, it would be Ethereum, a currency that’s just as known, but only as the little brother to Bitcoin.
So, following the process set in the first example, we’ll start out with a cursory test to see what the relationship looked like historically. To execute this view, we would simply just long BTC and short ETH.
It turns out, this has been a pretty interesting trade for the past 5 years:
Keep reading with a 7-day free trial
Subscribe to The Quant's Playbook to keep reading this post and get 7 days of free access to the full post archives.