The Dirty VIX Might Be The Cleanest Alpha Yet. [Code Included]
Our obsession with volatility is just getting started.
For awhile now, we’ve been spending a bit of time in the niche corner of volatility markets. Well, by a bit, we mean practically every waking hour — but nevertheless — we recently launched our primary strategy that aimed to sell volatility using the VIX1D index. We’ll be doing another update on that soon (and other strategies), but here’s a peek into how that’s been going:
By the way, join us over at The Quant’s Playbook’s Discord! 😄 Here, you can ask any questions you may have regarding strategies, code, brokers, or whatever else comes to mind!
But today, we want to take things a step further.
Going further back in time, we ventured out to build a simple prediction model that aimed to predict whether an asset would go up or down in the next day:
The theory was: if we had a model whose accuracy was as low as 52%, we would still have a major +EV edge if we used options on that model since the returns are asymmetric.
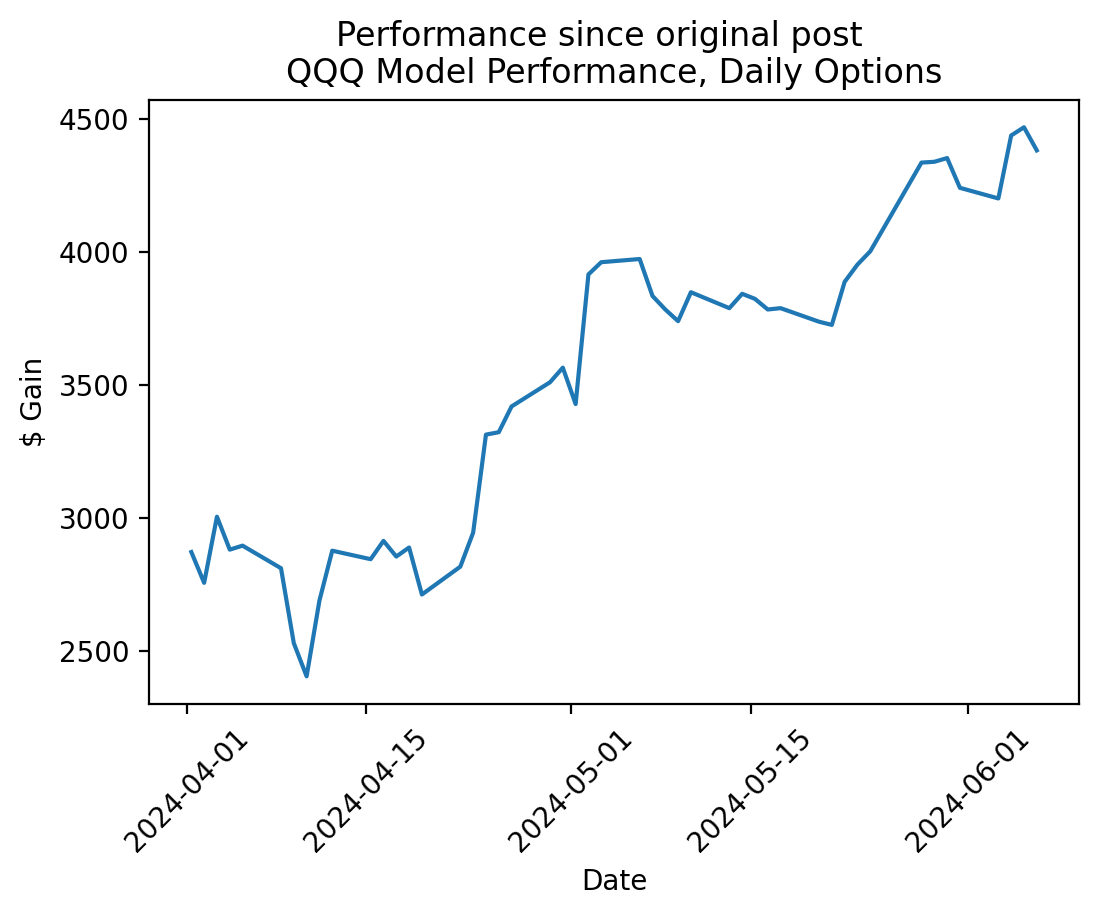
So far, this theory has continued to prove correct as the model has remained profitable:
While ultimately profitable, most of the profits come from occasional days where there is a big move and we make multiples on the position. It’s a feature, not a bug.
But what if we only made trades where the outcome was always a big move?
In theory, even if our accuracy dropped to 50%, our edge would still skyrocket since the outcome would always be either 2-4x or a moderate loss in the original position (time value is retained). The problem is, large moves in big ETFs like QQQ are relatively rare – however, in the single-stock space, these big moves are a dime-a-dozen.
All we need is a way to effectively know when a stock is going to have a big move, then once we have that date, we can pass it into our prediction model and hope the direction is correct. The individual bet might be wrong, but over enough samples, we would make a lot of money.
A tough challenge, but one we’re equipped to solve. To begin, let’s start with what we already know.
It All Goes Back to the VIX
As we’ve repeatedly demonstrated, the VIX1D is a phenomenal predictor of next day volatility in the S&P 500:
So, first things first, if our goal is predicting big moves in a stock, why not just create a VIX1D for the individual stocks?
This starts us off with two challenges (and two solutions):
Problem 1: Most stocks don’t have 0-1 DTE options.
Solution: We can use a rolling expiration date closest to 7 days. This helps provide stability in contract selection as well as relevancy since it represents near-term pricing.
Problem 2: The VIX1D calculation is complex and compute-intensive.
We can use a “dirty” approximation of just using at-the-money implied volatility.
So, we will construct our “dirty” VIX as follows:
We pull the options chain with the maturity closest to 7 days (>= 7).
We pull the at-the-money strike and calculate the 1-day expected move
1D Expected Move = Implied Vol / sqrt(252)
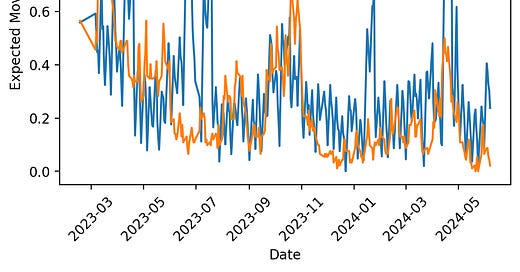
Simple enough, but let’s see if this quick and dirty approximation holds up to the real thing. To do this, we’ll run those steps on SPY, then compare our own index to the real VIX:
As demonstrated, this extremely simple methodology quite accurately replicates the VIX index, posting a correlation of ~92%.
So, now that we have a solid way of getting a VIX for any given stock, let’s get our hands dirty.
False Flags in Voltopia
In order for our strategy to ultimately work, we need to be sure that we’re targeting idiosyncratic volatility. Essentially, if the implied volatility of the market goes up, so to will that of individual stocks. We want to identify situations where the volatility of a stock is specifically related to that stock and not just apart of general market volatility.
If the broad market is expecting low volatility, but the given stock is expecting high volatility, it implies that the options pricing carries information that is uncorrelated to the general market.
To figure this out, we need to pull a concept from our friends in the data science department.
Min-Max Normalization
Before explaining what this technique is, we first need to see why it’s important.
Let’s run our VIX calculation on TSLA and try comparing the raw numbers with that of the standard VIX:
Naturally, this incomprehensiveness makes sense – on an absolute basis, single stock volatility will almost always be higher than index volatility. So, in order to meaningfully compare the single stock expectations with that of the broader market, we need a way to normalize the values.
Keep reading with a 7-day free trial
Subscribe to The Quant's Playbook to keep reading this post and get 7 days of free access to the full post archives.


![Papa's Got A Brand New Options System [Code Included]](https://substackcdn.com/image/fetch/$s_!jiu5!,w_140,h_140,c_fill,f_auto,q_auto:good,fl_progressive:steep,g_auto/https%3A%2F%2Fsubstack-post-media.s3.amazonaws.com%2Fpublic%2Fimages%2Fe4ad301a-ef65-4c7d-8ddd-5160e1092a9f_1200x768.png)


