A Junior Quant's Guide to Pattern Recognition
Past performance isn't indicative of future returns — but we keep checking anyway.
As a trader, you have an incredibly tough job — take the following scenario for instance:
On June 1st, an S&P 500 restaurant company announced quarterly earnings that came in way hotter than expected, and the stock jumped +25% overnight. The report was kept under tight wraps, so unless you were directly involved with the company, there was no legitimate way to know that in advance.
Sure, you could work your tail off trying to get ahead of the news — tracking parking lot visits, conducting interviews with customers, scraping executives’ LinkedIn posts to sentiment analysis models — the whole gamble.
But sometimes, you just can’t know the future.
Still, the potential rewards are too great to walk away. So, you, like all traders at one point, get a new idea for predicting the future — looking to the past.
After all, the saying goes: “history doesn’t repeat, but it rhymes.” Why shouldn't that apply to markets?
Now, we’re not new to this. We know that when “pattern recognition” comes up, it’s usually followed by more novice approaches — specifically, chart-based trading with shaky track records. We’re not here to dismiss those traders entirely, but let’s be honest — there’s a better way.
This is a common point all quantitative traders eventually land at, so it’s only right that we take some time to dive into some experiments trying to make a buck with this route.
This is a crossroads all quantitative traders encounter, so today, we're going to run a few experiments — not with the expectation of finding a crystal ball, but to give the pattern recognition game a fair shot, explore its strengths and weaknesses, and maybe uncover something interesting along the way.
Without further ado, let’s get into it.
Pattern Recognition, Without the Astrology
Now, in order to play the pattern recognition game, we need some kind of starting framework.
We’re a quantitative finance publication first, so we’re going to be a little plucky here and draw from our friends in the math department — but don’t worry, we won’t go so far into the weeds that you’ll need a graduate degree to keep up.
To begin, we’ll start with a surprisingly intuitive concept:
Euclidean Distance
It may sound intimidating, but this just a way of calculating the distance between two points.
When applied to a time series — like price or return data — it gives us a single number that summarizes how “far apart” two sequences are in shape and scale. A smaller number means the patterns are similar; a larger number means they aren’t.
To make this more intuitive, let’s walk through a real-world example.
We’ll start with one sample price series — the performance of the S&P 500 on a given day:
With a price series in hand, we can run an interesting experiment: when the day looked like this leading into the final hour, what usually happened next?
To answer that, we’ll need a way to identify the days that were most similar to the current one and then we can analyze what happened from there.
That’s where Euclidean distance comes in.
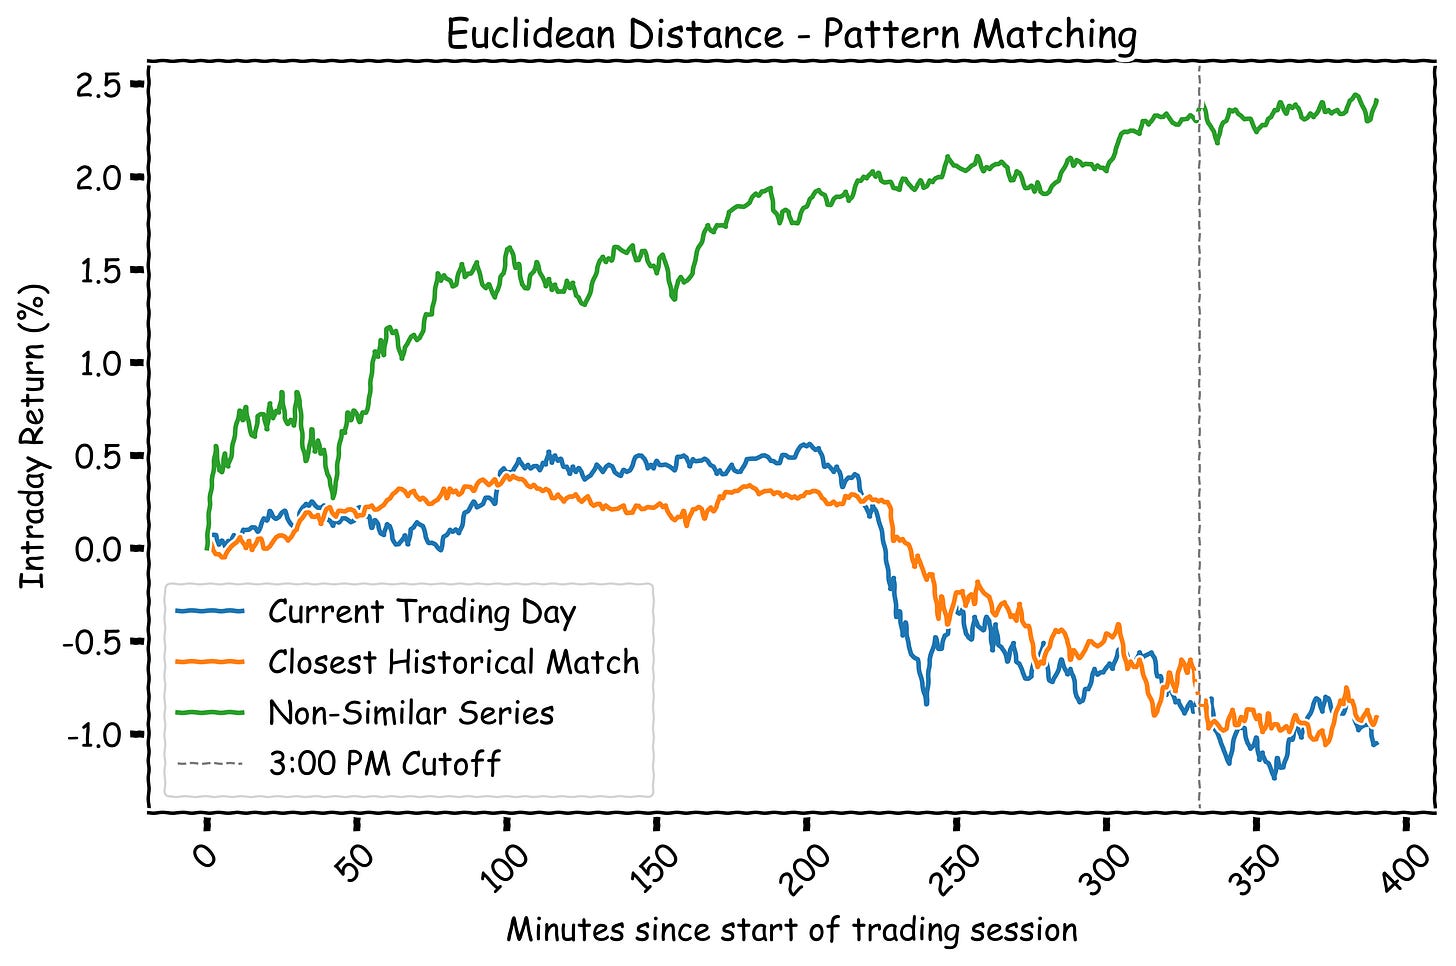
Because it gives us a clean, interpretable number, we can iterate through historical dates and find the closest matches using only the data available up to the 3PM cutoff:
Remember: The lower the Euclidean distance, the more similar the datasets. The higher the value, the less alike they are.
As demonstrated, this approach does a pretty decent job of matching the shape of time series, with the closest match often looking almost identical, at least optically.
Now that we have the tool, we can start to build a sample strategy to see how effective it actually is:
For any given trading day (up to one hour before close), we find the 10 most similar days based on Euclidean distance.
Of those 10, we take a majority vote to estimate the final hour’s direction.
If 7 of the 10 similar days closed higher, we consider that a 70% likelihood the current day will do the same.
If there’s a 50/50 split, the default is long.
Based on the predicted direction, we long or short $1,000 worth of SPY and hold for 1 hour until close.
Repeat.
Now, if you’re going to do this quantitative trading thing seriously, you need to be able to anticipate the results of a test before writing a single line of code.
So, before we dive into the results, let’s talk about what we’re up against:
Information Blindness: This, like most pure quantitative approaches, is totally oblivious to real-world information. We’re matching data by similar shapes, but not factoring in things like regimes, idiosyncratic events (e.g., Fed talk), or any other catalysts driving price.
Short-Term Variance: The shorter the timeframe, the higher the randomness. Most days are just noise. If the S&P happened to go up on some random Tuesday, it may not have been driven by anything meaningful and our shape-matching model could end up "learning" randomness.
So, with those limitations in mind — what do you think the results will be?
Take a second and try to predict it.
While you’re thinking:
If you’re a paid subscriber, truly—thank you. ❤️ Your support helps us keep pushing further: better data, better tools, better research.
If you’ve been enjoying the work and want to support what we’re building here, consider becoming a paid subscriber. It means more than you think, and it helps us keep doing this right. 🫡
Alright, now let’s dive into the results:
Keep reading with a 7-day free trial
Subscribe to The Quant's Playbook to keep reading this post and get 7 days of free access to the full post archives.


