
Why 2025 Belonged to the Quants
No doubt about it, this was a year for the quants.

As the year comes to a close, there’s one statement that captures it best:
This was a year for the quants.
To show why, we’ll start with a brief recap of our live strategies, beginning with our time-series momentum portfolio:
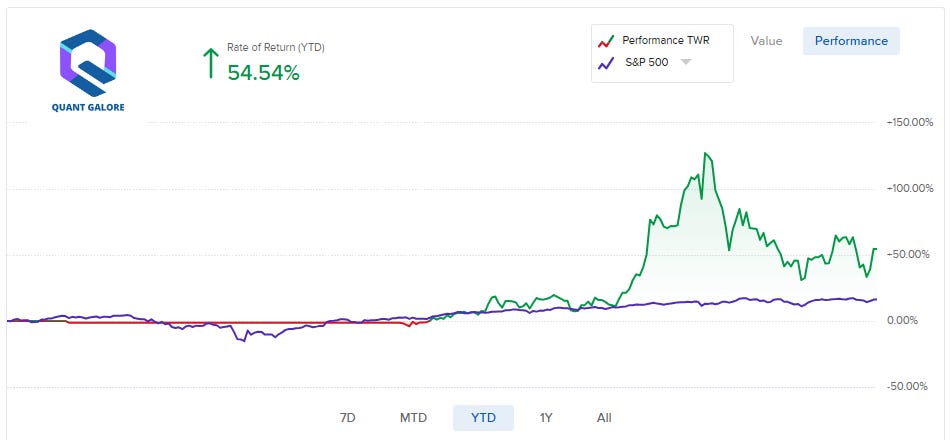
The approach itself is deliberately simple:
On the first calendar day of each month, we query all stocks with at least 6 consecutive weekly option strips and at least $50m of daily volume.
For each valid stock, we calculate a momentum score using a 12-1 lookback window (last 12 months of data excluding the most recent one) and sort the selection from highest to lowest scores.
We purchase the 10 with the highest score and hold them in equal-weight until the next month.
This is a textbook expression of the momentum factor; one that has persisted across markets and regimes for well over a century.
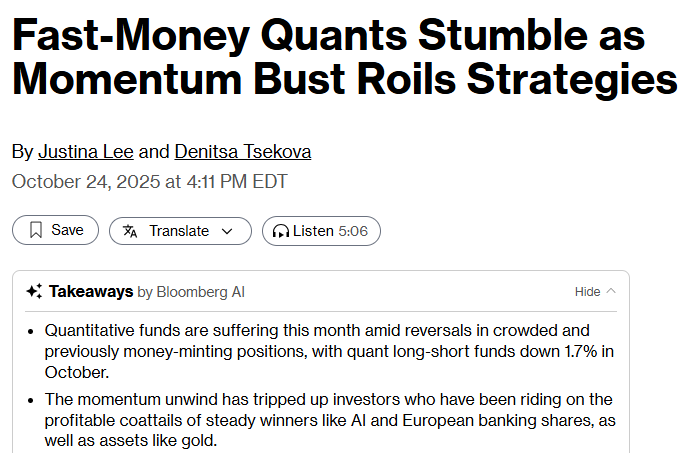
As the PnL snapshot from Interactive Brokers shows, the strategy experienced periods of both extreme euphoria and sharp drawdowns this year, particularly during the unwind of the AI and quantum-computing trade:
Even so, it finished the year with a solid gain, reinforcing a familiar lesson: simple ideas, applied consistently within the right universe, tend to endure.
Our next core strategy has been a quantitative, tactical approach to short selling:
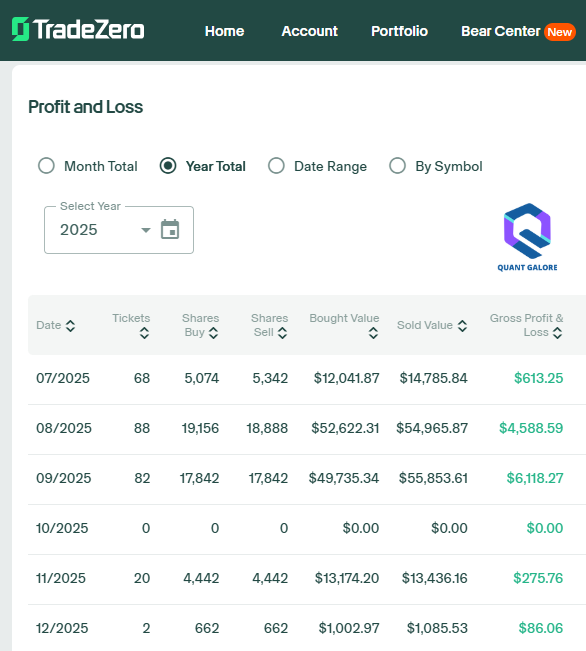
You can get a better read on exactly what we’re doing here:

Now, short selling carries a structural asymmetry that can’t be engineered away: the maximum gain is capped at 100%, while losses are theoretically unlimited. Even if the signal is strong, you’re guaranteed to see that grim-reaper over a long enough time horizon.
Eventually, we were reminded of that reality.
On an otherwise routine trading day, our morning process produced a typical basket of 10–25 names. As usual, we entered shorts at the opening auction and planned to cover at the closing auction.
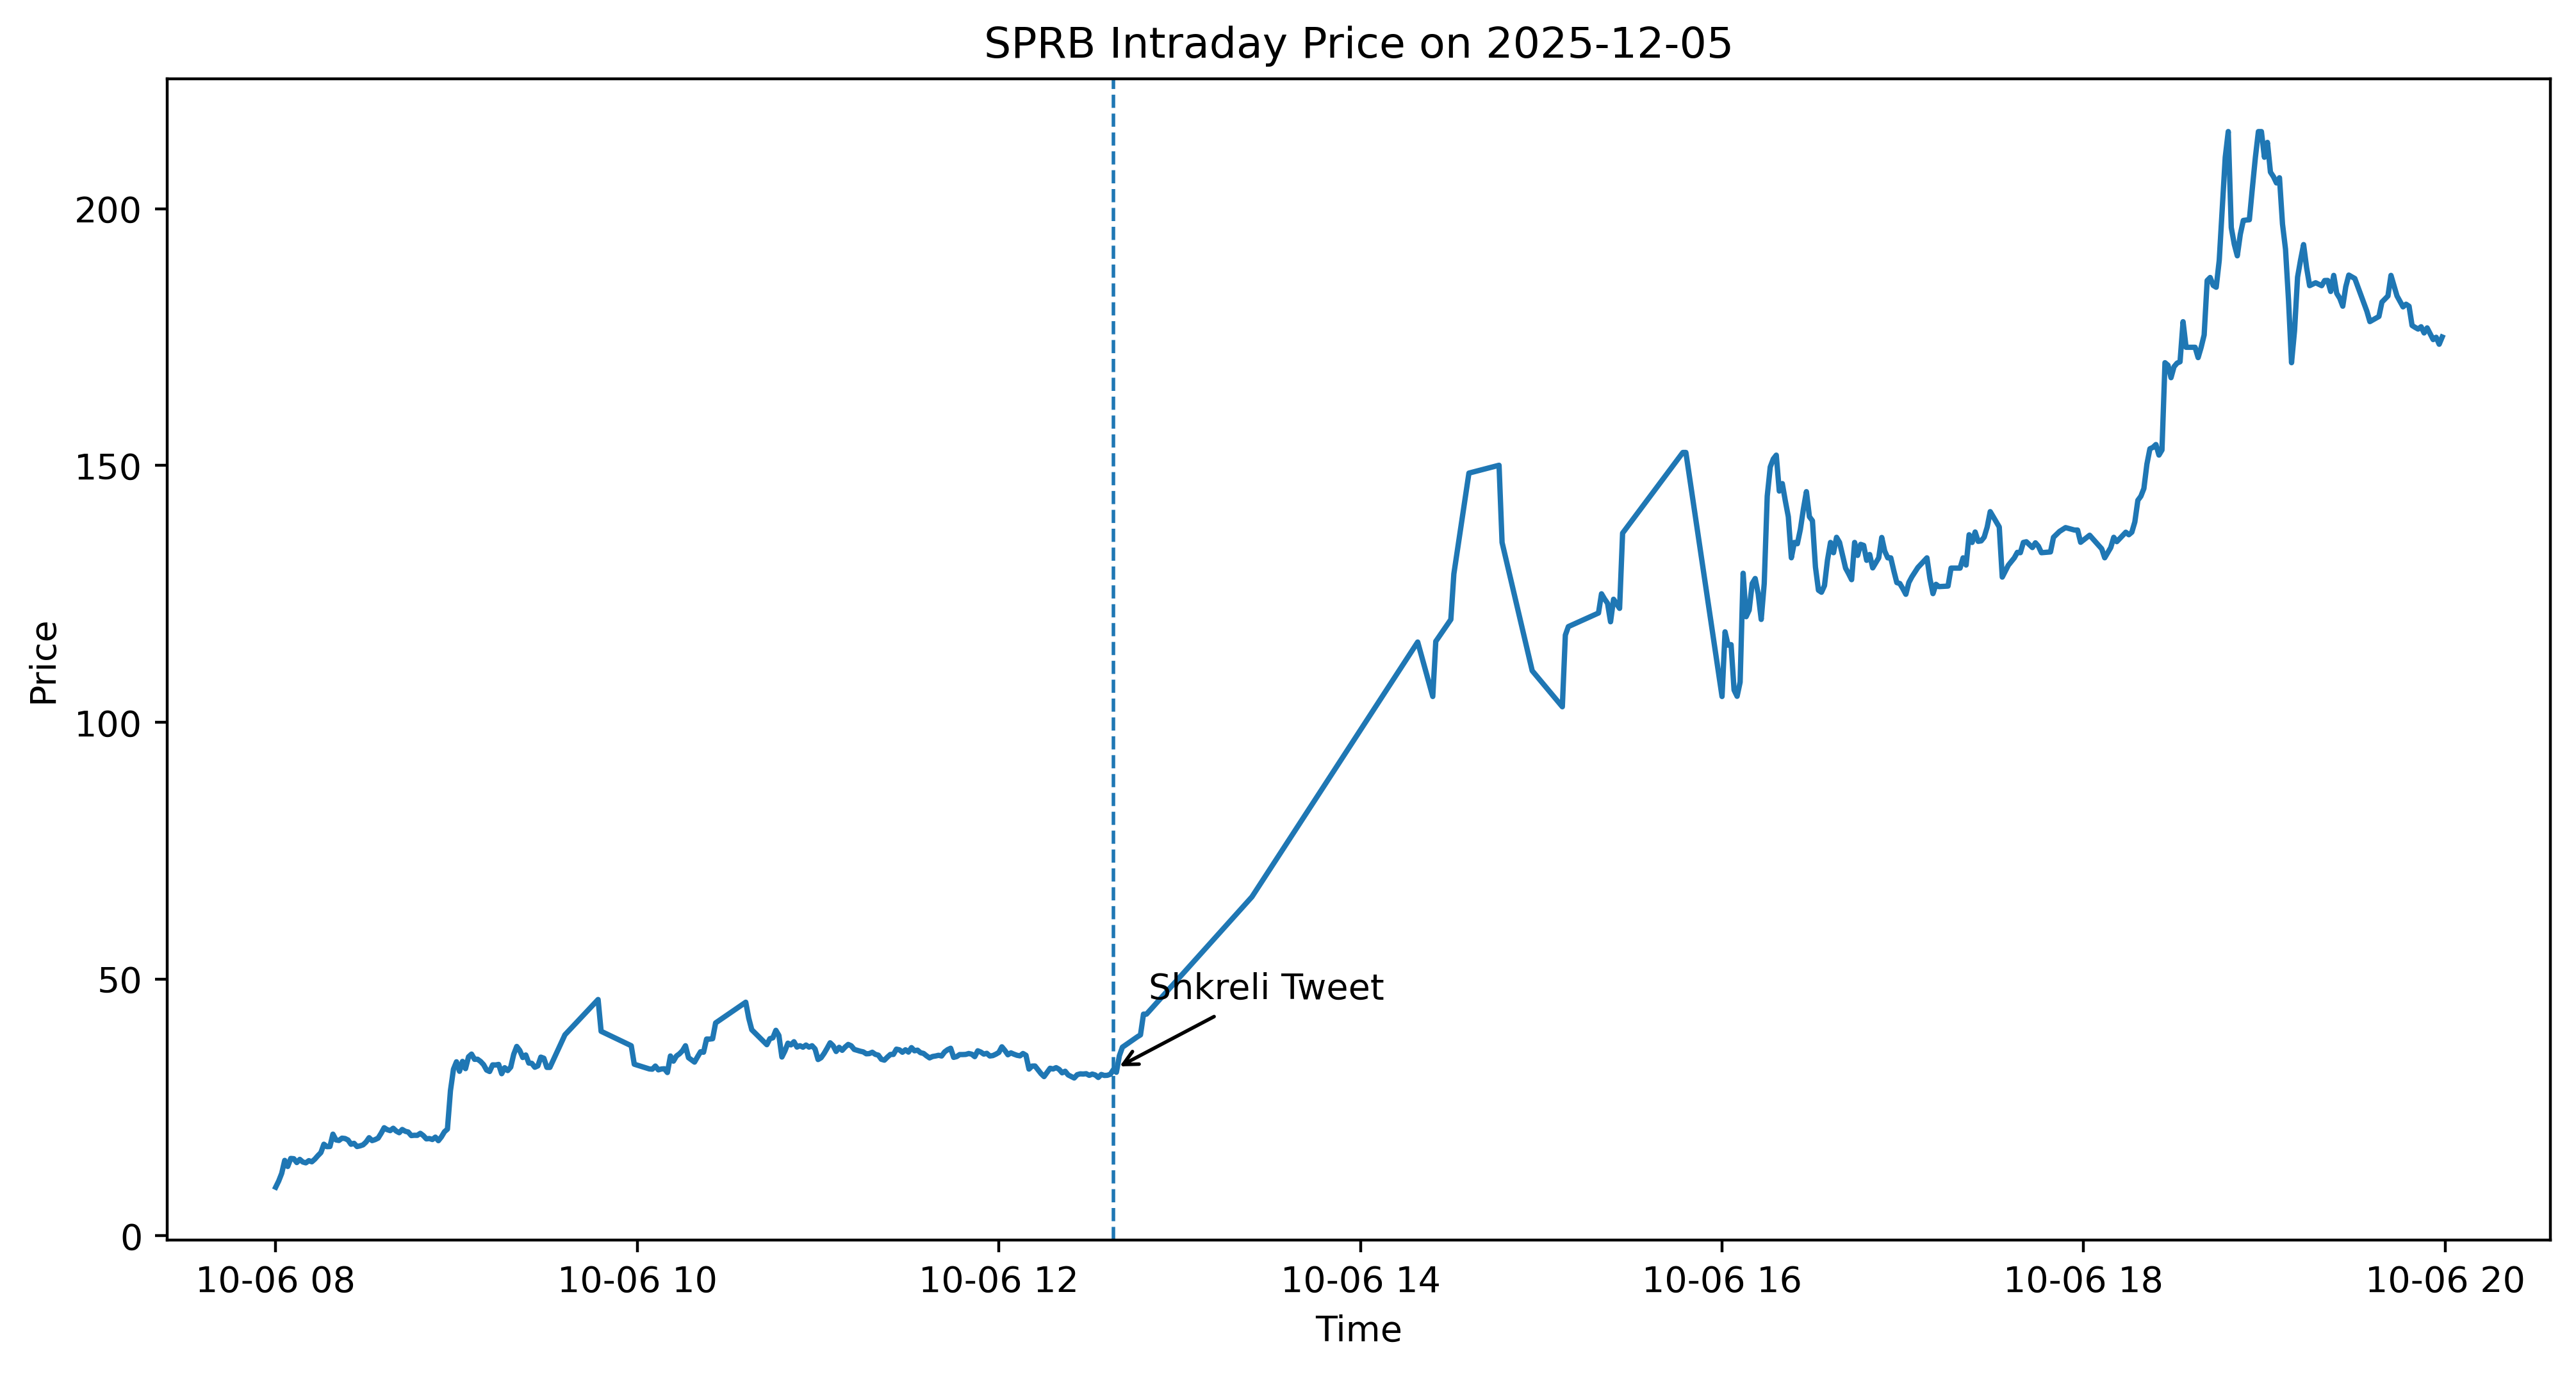
Things were going as expected, until a well-known market figure made a very public comment:

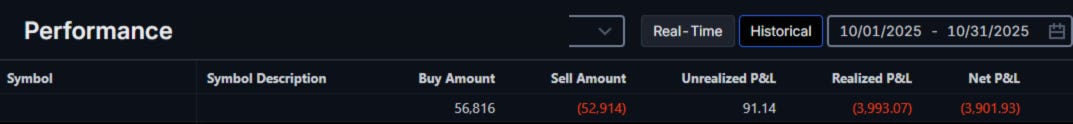
What followed were trading halts, extreme volatility, and a price path that looked like this:
Reviewing the trade records later that day made the impact clear:
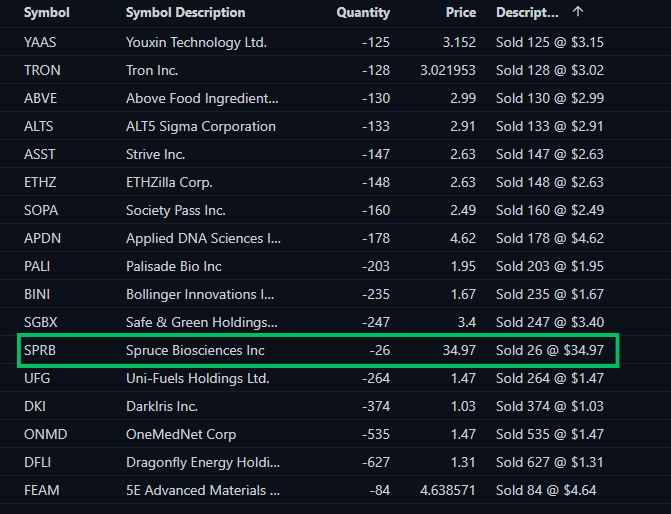
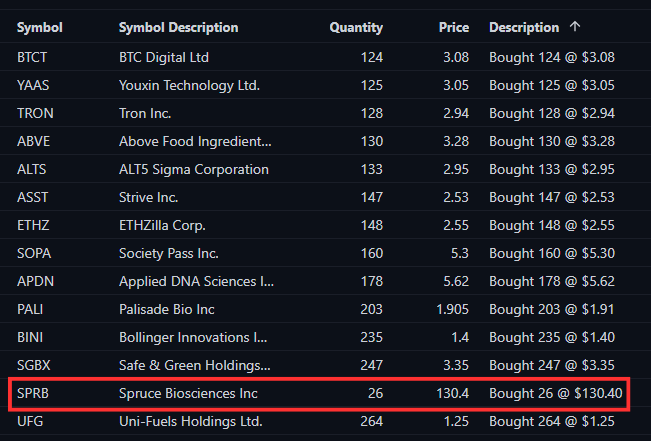
We ultimately covered the position at roughly 4× our entry price. While this was far from a worst-case outcome, it was a defining reminder that “two-standard-deviation events” are not theoretical.
Now, we run a portfolio approach precisely to absorb outliers like this; but still, the experience warranted caution. We paused the strategy for roughly a month while exploring other markets and re-examining the risk profile.
When we returned to the data, nothing fundamental had changed. The historical characteristics matched the live experience, including the overall positive return profile. With that context, we’ve begun re-integrating the strategy at size; this time with a more explicit acknowledgment of its tail behavior.
"Why not just use a stop loss?"

We often observe that adding a stop loss tends to drastically hurt the EV of a strategy, as it often triggers just from routine variance of the underlying price (path-dependency risk).

This creates losses in otherwise profitable trades. Additionally, like with SPRB, an immediate extreme move paired with halts make it much less likely that the stop loss order would fill at the ideal price set.
Nevertheless, in each of these strategies, every single one, one truth comes up again and again:
Most of the edge comes from the universe selection, not the strategy.
For our long momentum portfolio, the universe is deliberately restricted to stocks with deep liquidity and sustained options activity. We’re not asking whether investors might be willing to trade these names — that demand is already established. The challenge just becomes isolating relative winners within the sub-group.
Applying the same ranking logic indiscriminately across the entire equity market produces far less reliable results, despite no change in the signal.
With this universe, we don’t have to predict if investors would be willing to buy these shares, we already know that they are — extensively. All we need to do is isolate the relative performers of the group; still tricky at times, but much more doable and actually likely to succeed over the long haul.
The same principle holds on the short side.
Our short universe is constrained to stocks with market capitalizations below $50 million at each point in time. These names already represent the least institutionally favored segment of the market. From there, the task is once again relative selection, not prediction.
When this logic is applied to large-cap stocks like MSFT or TSLA, it consistently breaks down; another example of how an otherwise reasonable strategy hinges on the specific universe chosen.
How We’re Approaching The New Year
For better or worse, we keep finding ourselves drawn back to the cryptocurrency space.
We’ve previously outlined our primary crypto strategy, which you can read about here:
At a high level, it’s a monthly rebalanced long-short portfolio: long BTC, short a basket of structurally weak tokens via perpetual futures.
It’s a sound approach, and one we’re comfortable running in production.
Still, it felt… incomplete.
Crypto is defined by its extreme dispersion and occasional explosive right-tail events. Our initial universe of liquid perpetual futures contracts tended to suppress exactly that behavior, by design.
In many cases, their realized volatility is not meaningfully different from that of single-stock equities (e.g., at the time of writing, BTC implied vol is ~40, marginally higher than that of Crude Oil (33).
If we wanted to get a piece of some of that explosive action, we’d need to return to our core principle: deliberate universe construction.
Rather than starting with mature, exchange-listed tokens, we began exploring the opposite end of the spectrum — newly created assets, before they even appear on a centralized venue.
That decision immediately exposed the scale of the challenge.
We started by querying all newly launched Solana tokens within a rolling eight-hour window, then measured their returns over the subsequent eight hours.
In that brief span alone, we observed roughly 5,600 new tokens; the equivalent of thousands of IPOs occurring every trading day.
The outcomes were sobering, laughable, and interesting:
Of the 5,600 tokens launched, only 2.4% generated a positive return over the next 8 hours.
Most observed no future price change due to 0 volume.
Only 0.4% had an average notional volume of at least $10,000.
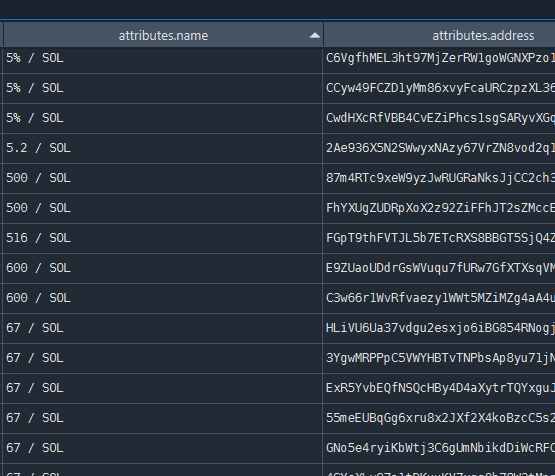
Now, to be fair, most of these coins were duplicates of other popular coins:
Instead of rage-quitting there (which might honestly be the best decision ☠️), we figured out a way to construct a more stable, yet fresh universe of tokens to choose from.
Once we had a more stable universe, we defined a crude, mock momentum strategy:
Each calendar day, at 8:00 PM, compute a momentum/volatility score for each asset and buy the top 10 in equal-weight.
The next day at 8:00 PM (24hr rebalancing), sell the assets and generate the new basket using the latest data/universe.
Repeat.
Here’s how that did:
Keep reading with a 7-day free trial
Subscribe to The Quant's Playbook to keep reading this post and get 7 days of free access to the full post archives.