Volatility Trading is Back, Seriously.
The business is volatility, and business is good. Our VIX system is off to the races.
A few weeks ago, I set out to see if it was possible to consistently make money selling 0-DTE options by using volatility indices and a real-time probability tracking system.
So far, it has not been a bad gamble:
Before diving in, I recommend a refresher on the approach:
Deploying A VIX-Based Volatility Frown System [Code Included]
The core of this strategy is to systematically collect high premiums on 0 days-to-expiration SPX options. Without using any historical data, we were able to create accurate synthetic option chains and also develop a real-time monitoring approach that shows us the live, dynamic probability of our position needing to be adjusted or closed.
Tail Risk, Who?
Tail risk is the number one factor in the long-term viability of any risk-based operation, so we’ll start by taking a look at how well the system was able to prevent and adapt to tail events.
The first observation, and one that adds justification for complete automation, is that the early warning system is really effective. Generally, market conditions are relatively calm and participants will offer you a return for accepting the risk of the contracts you hold. But just like with any insurance business, sometimes things happen, and you have to actually payout on the risk you accepted.
The system was built to avoid that as much as possible, so let’s see how it did when that day finally came.
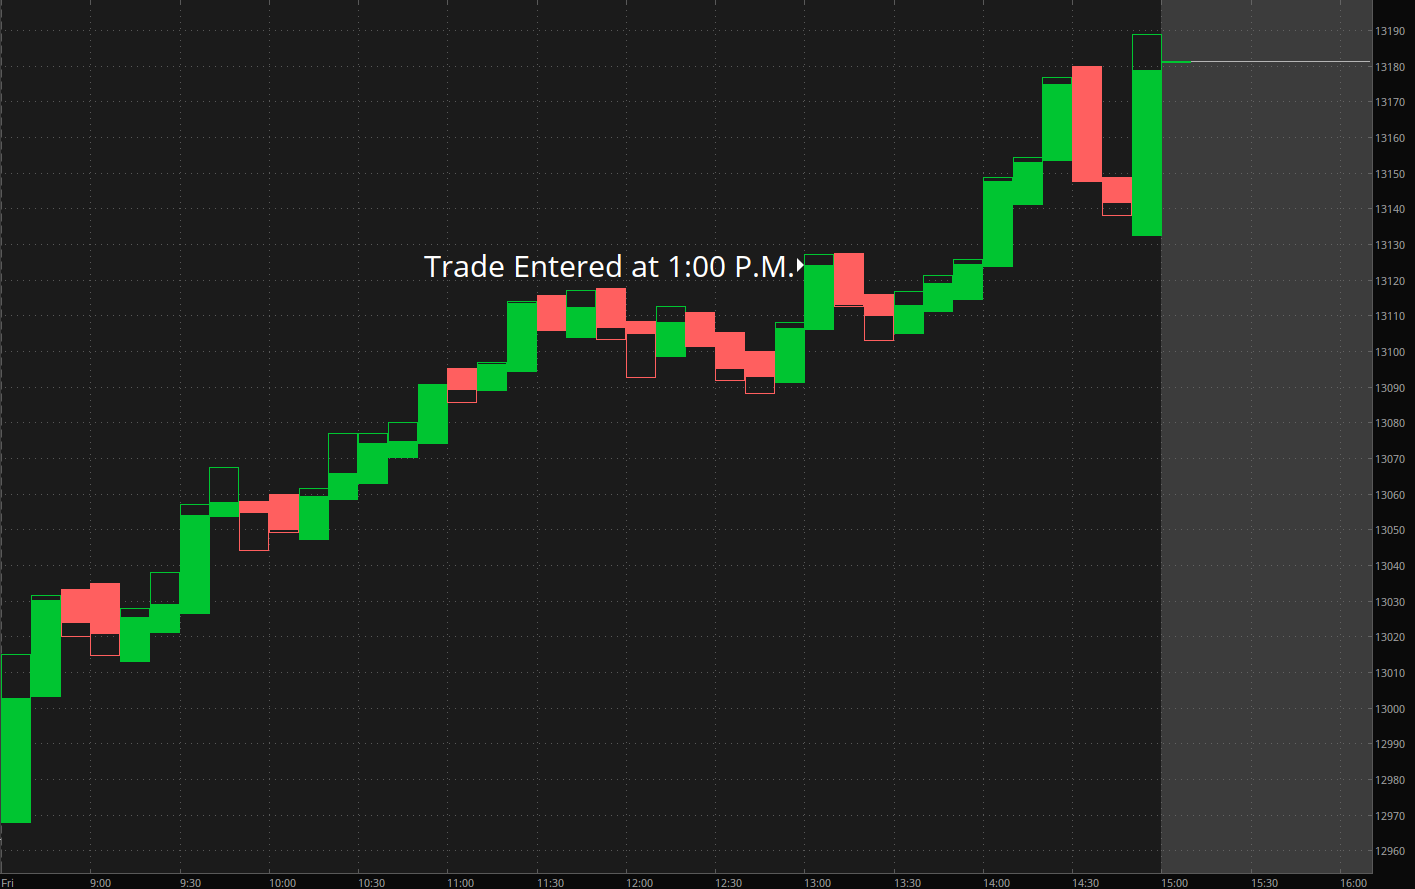
On March 31st, 2023, the market experienced a rally that lasted throughout the trading session. This makes no difference to us, as the system targets volatility every day, so we put the trade on as usual:
Once the trade is on, the system then starts generating the real-time probabilities based on real-time underlying prices:
To manage risk, the strategy is that whenever the system estimates a >= 80% chance of the option going in-the-money, you immediately close the at-risk side and hold on to the out-of-the-money side. The theory is that, you buy back the at-risk position at an attractive price since it is still out-of-the-money, and you hold on to the premium you’re already going to collect from the side that will expire out-of-the-money.
As demonstrated in the chart above, the index continued to rally in the latter-hours of the session, forcing us to hedge the position. Let’s take a look at how that unfolded:
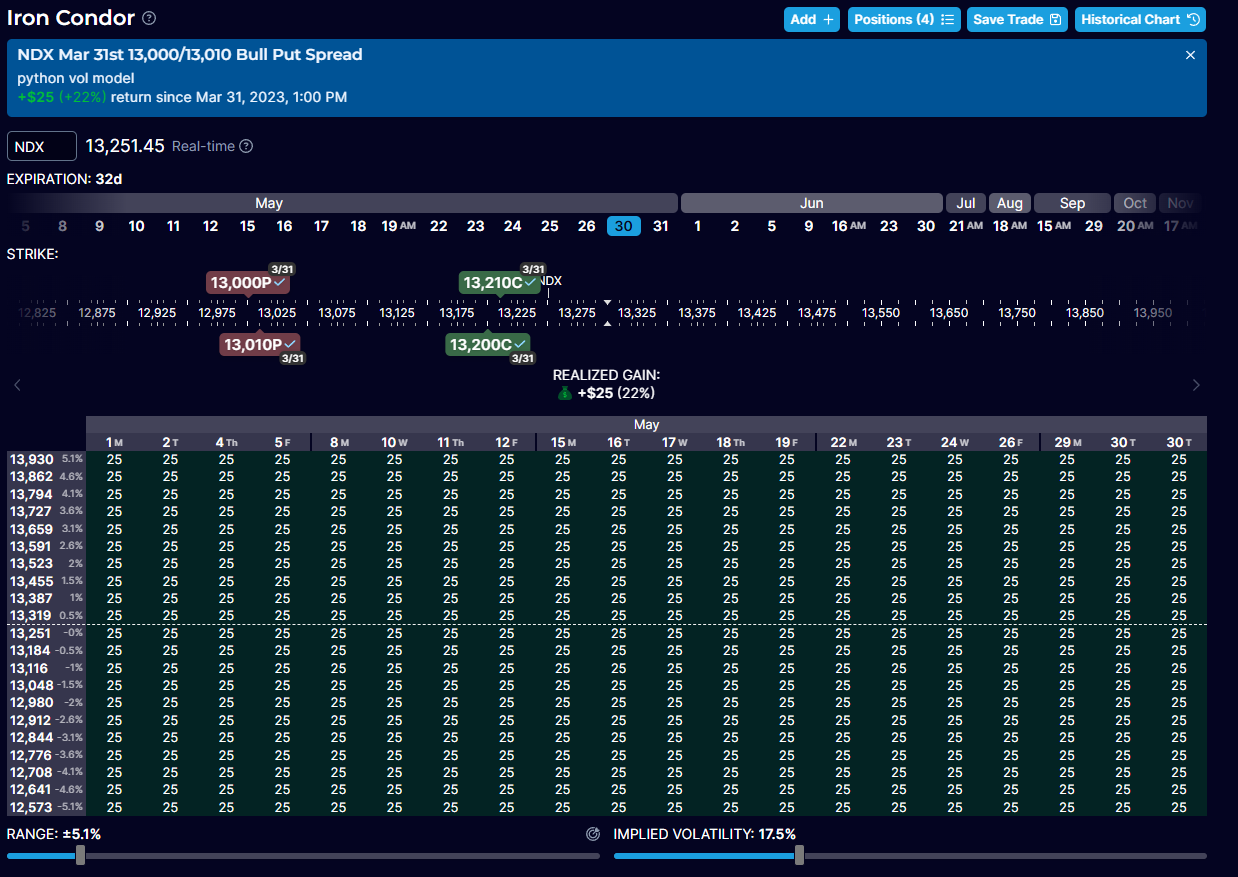
Our position was an iron condor consisting of the following call strikes (-13200 / +13210) and the put strikes (-13010 / +13000). So as prices rose, it was imperative that the call side be adjusted:
Because the adverse move happened late in the session, the extrinsic value of both contracts had reached a low, resulting in drastically lower prices. This allowed us to buy back the short call at a profit, while we sold the long call at a loss. When summed, the total loss on the call side was -$22 ($123-$145).
Were we to let the call side expire in-the-money, the loss would be equal to the strike width minus the premium; so a $10 wide position (13210 - 13200), and a $65 credit means a maximum liability of $935 ($1000 - $65). So, by utilizing the system to close the position early, we only realized 2.3% of that!
After closing the call side, we were left with the put side which was able to expire out-of-the-money:
Side Effects
This demonstrates that there is indeed an effective way of mitigating the “pennies in front of a steamroller” effect, but it also has a trade-off.
Because the system has a cutoff of 80%, it exits the trade before the adverse event materializes, but sometimes that event does not materialize. The effect of this is that we will take smaller profits (and sometimes losses) in scenarios where, if we held until expiration, we would gain the full value.
But honestly, this is a side effect, not an issue. It is impossible to know the true value at expiration, so in exchange for that uncertainty, we are a bit more jumpy. Over time, the profits will be less than the theoretical optimal, but this is the most systematic option we have for real-world conditions.
Further Observations
You may have noticed that the original methodology used SPX, but we traded NDX. The reason for this is that the premiums offered for Nasdaq options are significantly greatly than those for SPX options. This is mainly due to the differences in the underlying contract exposures; with 1 SPX option contract having a notional value of ~$208,000 ($4,169 * 50), and 1 NDX contract having a notional value of $1,324,500 ($13,245*100).
The Nasdaq-100 is significantly more volatile than the S&P 500, so instead of our base volatility index being the VIX, we use the VXN; the CBOE Nasdaq-100 Volatility Index. It has the exact same methodology and function as the VIX, except that it uses NDX options as opposed to SPX options.
When trading index options, volume and open interest are misleading signals of liquidity. In a study of over 70,000 NDX executions, it was found that the average execution traded only 2.7% away from the midpoint: Index Options are More Liquid than the Screens Indicate
If you were able to gain value from this post, I can guarantee that you’ll gain value from some of my others:
Happy trading! :)


![Deploying A VIX-Based Volatility Frown System [Code Included]](https://substackcdn.com/image/fetch/$s_!8g9E!,w_1300,h_650,c_fill,f_auto,q_auto:good,fl_progressive:steep,g_auto/https%3A%2F%2Fsubstack-post-media.s3.amazonaws.com%2Fpublic%2Fimages%2Fe12a6c58-74c1-4d96-8331-9e694ebed478_850x312.png)


Hey is there a plan to re-visit this and hook it into the polygon API?
Hi,
first day closed with a profit :)
By the way I noticed that NDX options have a very wide bid/ask spread, compared to the SPX ones.
It would be nice to have a place to share thoughts and experiences about your ideas explained in these posts. Have your ever thought about creating a discord channel (or a telegram one) so your followers can stay in touch and help each other?