


It's Official, We're Dispersion Traders Now.
Outsmarting the options market is proving difficult, however, there just might be a way.

Before we dive in, I must regretfully admit that we had an oversight in our initial run of this experiment. To quickly recap, we’ve been attempting to use volatility surfaces to profitably deploy a long-volatility options strategy. Take a refresher if you’re up to it:
![You Can Be A Volatility King Too. [Code Included]](https://substackcdn.com/image/fetch/$s_!KRFA!,w_140,h_140,c_fill,f_webp,q_auto:good,fl_progressive:steep,g_auto/https%3A%2F%2Fsubstack-post-media.s3.amazonaws.com%2Fpublic%2Fimages%2Fbc038129-6135-4486-b1d7-49a8ddb58bf3_3191x2434.png)
While our method of building the surface is still solid, our error came from how we potentially overfit the performance of our strategy. See if you can spot where we went wrong:
Generate our volatility signal for the options where we had an edge
Save the performance of those options & repeat the next day
Combine all the collected data and isolate the characteristics of the positions that performed well
We create our forward-looking criteria based on the characteristics of those that performed well
For instance, only contracts with a days to expirations greater than 1 but less than 4, no values greater than X for our feature, etc.
We run a backtest using this new criteria and get strong results.
Did you see it?
By basing our strategy on the options that did well, we committed the cardinal sins of:
Lookahead bias
There would be no rationale for the criteria if we hadn’t looked ahead to see what already performed well
Survivorship bias
We chose the strategy’s criteria based on the options that “survived” (were profitable)
Overfitting / Data Hacking
We’re likely being too harsh, but by building the strategy in semi-reverse order, we were essentially just filtering out the bad trades to make the backtest more profitable
We were made aware of this error after trying the criteria on 6 months of totally fresh data, for performance that was… not great.
All deeply heinous acts, and for that, I apologize.
However, the story doesn’t end here.
At The Quant’s Playbook, we learn from our mistakes to come out ahead stronger. So, before we dive into our revamped approach (hang in there!), let’s go over how we’re going to avoid this from happening again.
A Pox on Overfitting!
The core of overfitting is tweaking your model/process to a dataset for great results, but that process performs poorly on unseen data because it is too optimized for that 1 dataset.
Our first solution is to move away from data hacking and move more into the strength of our features/strategy:
If we are using a model, we want to only see the strength of our features. So, if we deploy a model and the accuracy is off, we shouldn’t isolate the instances where the accuracy was correct and tailor the model to that — we should find a better feature instead.
However, what about when we see strong accuracy from a model/strategy? How do we get proof that it will work on new data or in the real world?
To answer this, let’s go visual:

In essence, our new approach will be to make multiple datasets from our original, with each set being unique enough to effectively act as new data.
We first take the entire period we want to test for and split it in two. Next, if we have say, 200 stocks, we shuffle those names and split it into 4 baskets. From this, we test our model and/or strategy with each unique subset.
This way, if we notice that our approach seems to only work on a few stocks and/or over a specific time period, we know that it might be time to scrap the approach. Ideally, our strategy/model will perform well on all unseen data samples because those unseen samples represent new, real life data.
So, now that we have some better measures in place to avoid the no-no’s, let’s get back on track.
The Vol Surface Rematch
Picking up where we left off — by building out our own volatility surface for all stocks in the market, we hoped to identify unusual kinks in the structure that would give us a heads up on which stocks were likely to move.
Our first big feature was the slope of the surface — essentially, “how much higher is the implied volatility of the nearest expiration compared to the IV of the next week’s expiration”? In theory, if investors were expecting significantly higher volatility for this week, but not as much for the week after, it could imply that the pricing is informed and the stock price is likely to move soon (this week).
On its own, this feature isn’t too bad. Here’s a visual of the relationship between how deep the slope is compared to what the stock does in the next day.

However, we want to change our approach to be more model-based, so we should try being a bit more creative. Just knowing the slope of the surface may carry information, but wouldn’t it also be useful to know how much the vol surface has changed? If today, the slope of AAPL was -20%, this feature might show up as a big signal for volatility, but if AAPL’s vol is usually -15% the signal is likely to be a false flag.
So, let’s see if using how much the slope changed might provide a boost to performance:
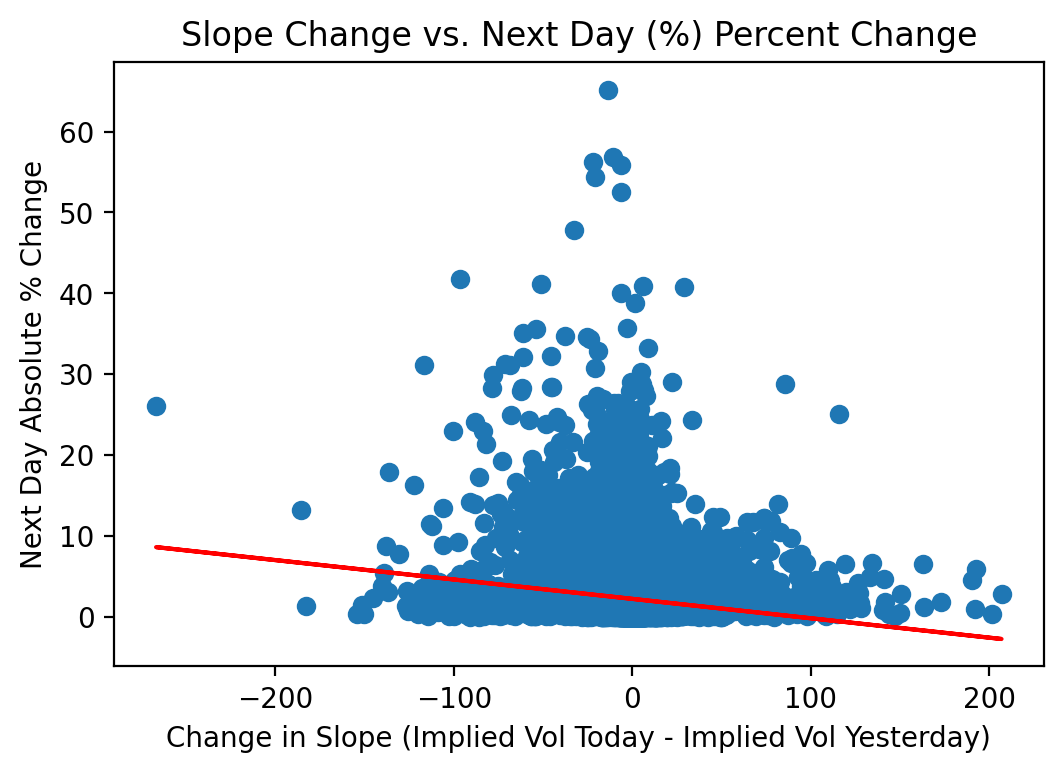
It doesn’t have a perfectly strong linear fit, but extreme negative changes in the slope are generally associated with higher realized volatilities and extreme positive changes are associated with lower realized volatility.
Negative % changes in slope = The market started to price in a higher likelihood of future volatility
Positive % changes in slope = The market started to price in a lower likelihood of future volatility
So, let’s throw it in.
We repeated this process of adding features to have a simple set of ~5, which we’ll look at in a moment. However, there’s an obstacle in the way of us being able to trade this.
Since most of our features are derived from implied volatility, we are essentially just repeating what everyone else already knows. This brings us to a tricky brain-teaser (challenge yourself to think of an answer before reading on — it might take you sometime, but you’ll have fun):
Everyone knows that stock A will move by 7% on open tomorrow. Because of this, options are priced richly and likely won’t generate a profit after the move.
How can you still profit on this move? You can’t buy options on the stock because the options are overpriced. You don’t know the direction of move, so you don’t know whether to buy or short.
Well, what if we took a page out of the dispersion trading handbook?
Keep reading with a 7-day free trial
Subscribe to The Quant's Playbook to keep reading this post and get 7 days of free access to the full post archives.