I Gutted The Entire Sports Betting Algorithm. [Code Included]
Baby neural networks, point spreads, and whole heaps of fun.
Traveling back to the last update to our algorithm—we found that more often than not, our synthetic odds were pretty close to the real odds, leaving limited room for an edge.
However, over the past few weeks, we’ve seen the incredible power of machine learning and how far creative feature engineering can take us:
So, we decided to gut the system and build a new one from the ground-up.
The Reconstruction
The main factor we needed to optimize for were the odds we received for each of the bets. We built the algorithm for player props, which are essentially wagers on actions made by a specific player. Because there are hundreds of players on any given day, the odds offered on these bets vary wildly:
So, we want to remove this volatility component and go for a bet type that is generally always the same. Luckily for us, we can find that stability in the “runline” bet:
The runline, also known as “the spread”, refers to how many points the favorite wins by. Let’s break that down further:
On July 22nd, 2023, the market estimated the Miami Marlins to beat the Colorado Rockies. In this case, that designated the Miami Marlins as the “favorite”.
The (-1.5) bet represents the Miami Marlins winning by 2 or more points.
The (+1.5) bet represents the Miami Marlins winning by less than 2 points or the Colorado Rockies (the “underdog”) winning outright.
To see why changing to this bet type is more advantageous, refer to the moneyline odds offered for that Miami Marlins v. Colorado Rockies bet:
If we bet that the Marlins will win through the moneyline, we need to pay $155 to make $100.
If we bet for the Marlins to win by 2 or more points, we pay $100 to make $135.
This, paired with the consistency of the odds set make the runline bet a suitable choice.
Feature Engineering
Previously, we used historical statistics and records to help build our predictions. But since we know that’s what the sportsbook also does, why don’t we just fast-forward?
Instead of using the stats as the features, we will use the odds as the feature.
The manually set odds better account for not only the historical records of the teams, but also for other factors like injuries, rain, and the other quirks that manual line-setters factor in.
Here’s how that data is structured:
Team 1 represents the favorite of that day and thus, “team_1_spread_odds” refers to odds for the -1.5 line. Team 2 represents the underdog, so the “team_2_spread_odds” refers to the +1.5 line.
If the favorite (team 1) wins by 2 or more points, a label of 1 is applied. If they win by less than 2 points or lose outright, a 0 is applied.
We source our odds from Prop-Odds, which is where we will likely also pull NBA odds from as the season gets closer to starting.
Model Training & Analysis
Since we structured the dataset as a classification task (0 or 1), we have a wide variety of models to choose from. Additionally, because we’re on the vein of trying new things, we’d like to see how a Neural Network would work on this.
Multi-Layer Perceptron (MLP)
This is arguably the most complex model we’ve covered, but it can be broken down into 3 simple functions:
Input Layer: An input layer just represents the raw data points. Within each layer exists neurons which describe some attribute of the data. For example, if a layer represents the odds for the favorite, a neuron would be whether that odd is negative or positive.
Hidden Layers: A hidden layer is the part that takes in the data and applies some transformation to it. For example, it may add a higher weight to games played at Wrigley Field, and a lower weight to games played at Petco Park.
Output Layer: The output layer represents the final prediction. Since this is a binary classification problem, there will be 2 output layers, but only 1 will be triggered for each prediction. For example, if the network estimates the favorite to cover the spread (win by >2), the output layer for “1” will trigger.
When combined together, this creates an artificial neural network (ANN):
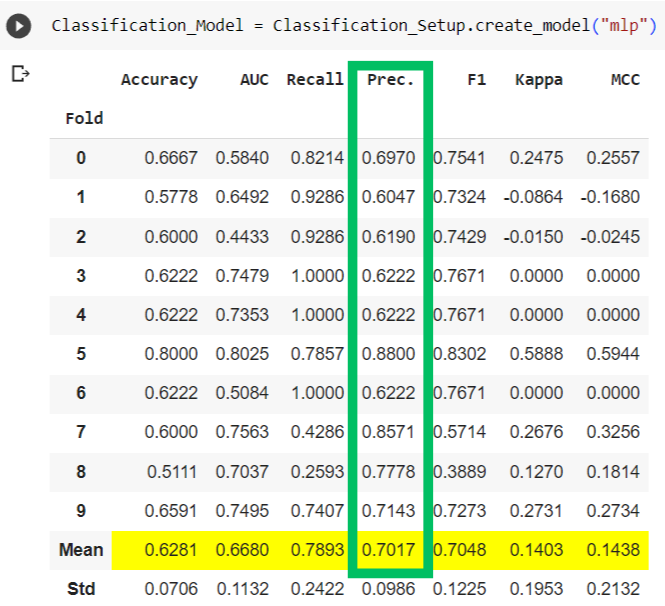
Let’s see how the performance of the model breaks down:
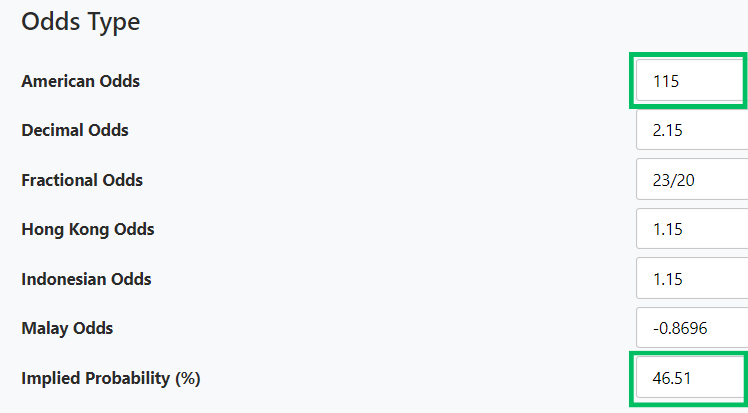
As usual, we focus on the precision column because we want to see the true positive rate. So, when the network predicted the favorite to cover the spread (-1.5 bet to payoff), it was correct ~60-70% of the time! Referencing our earlier comparison of odds, the odds for this bet range from about +115 to -130, so we can use that to compute our needed break-even win rate to come out ahead:
Since our precision is higher than the necessary break-even odds, and we know that the odds of this bet are stable, we are good to dive into testing!
Code
We store our data in simple MySQL databases and the models in Colab notebooks. If you don’t have experience in setting these up, I highly recommend visiting: Machine Learning for Sports Betting: MLB Edition, where we walk through the entire process with a similar workflow, going from data all the way to production.
To get your hands on this and replicate it yourself, let’s first go over the workflow:
Register for a prop-odds API key
Run the “mlb-runline-dataset-builder.py” file
This builds the original dataset and takes about 15-30 minutes
Run the “mlb-runline-daily.py” file
This is the dataset that will be used to get the predictions for the games of that day.
In Google Colab, run the “MLB_Runline_Training.ipynb” file
This file is responsible for comparing and training the dozens of available models. It isn’t necessary to make any changes to the model, but you have the freedom to experiment.
Running the file will create a .pkl file containing the model of your choice, be sure to upload this to your drive.
In Google Colab, run the “MLB_Runline_Production.ipynb” file
This file will deploy the model you saved and generate predictions and theoretical odds.
In order to update new, future data points without having to re-build the entire dataset, run the “mlb-runline-dataset-production.py” in lieu of the “mlb-runline-dataset-builder.py”.
To start tracking predictions before going live, visit the action network.
Finally, you’re all set! 😄
GitHub: https://github.com/quantgalore/mlb-runline
Happy trading! 😄


Good morning, I was getting some NaN on the team names this morning. It appears that the short name coming from the API has been altered. So the CSV file with the Long names needed to be edited. Ex. 'ARI Diamondbacks' to 'ARI Diamondbacks - ARI Diamondbacks' Just wanted to give you the heads up. Cheers
Hi there,
New subscriber here. I've read this series of posts and find them very enjoyable. Thank you for sharing all of this and for the code.
A quick question: I signed up for the prop-odds free api key and exhausted my 2000 monthly API calls without being able to complete 'mlb-runline-dataset-builder.' Are you using their 'algo better' subscription level? Will 100,000 API calls in their 'algo better' level allow for this algorithm to be run multiple times per month? I am not sure how much of the builder I actually made it through (meaning how many API calls are needed to be made).