Exploiting The Volatility of Volatility
A deep dive into the fascinating world of Volatility².
In financial markets, volatility represents how much an asset’s value will fluctuate over a given time frame. This volatility value is especially important in pricing derivatives like options, as the price must accurately reflect the historical volatility and risk of the asset.
Volatility is also important at a portfolio management level, primarily in the form of beta. If a portfolio manager wishes to mimic the returns of the S&P 500 through a basket of just 10 stocks, they would need to know the beta of the combined portfolio to effectively reach this goal. A beta of 1.5 may make their portfolio too volatile to keep up with returns, and a beta of 0.5 may not make it volatile enough. So knowing that expected volatility is extremely useful.
But what about measuring the volatility, of volatility? What if we wanted to make a guess on how volatile volatility would be over the next x days?
Thankfully, there is quite an effective way of doing this:
The VVIX Index - Background
The standard VIX index works by tracking the prices of out-of-the-money S&P 500 options that expire in about 30 days. As investors pay more for out-of-the-money options, the VIX increases and signals the potential for increased future volatility in the S&P 500.
The VVIX works in a similar way, except instead of using OTM S&P 500 options, it uses OTM VIX options. The goal of the index is to measure the expected volatility of the final VIX settlement price in 30 days.
The VIX forward settlement process involves calculating the average of the daily settlement values of the front two VIX futures contracts that expire in a given month, and then applying a "haircut" or discount to this average to account for the expected roll cost of the futures contracts. The resulting value is then used to settle the VIX futures contracts for that month.
So, the VVIX uses option prices to estimate how much that final price will change by.
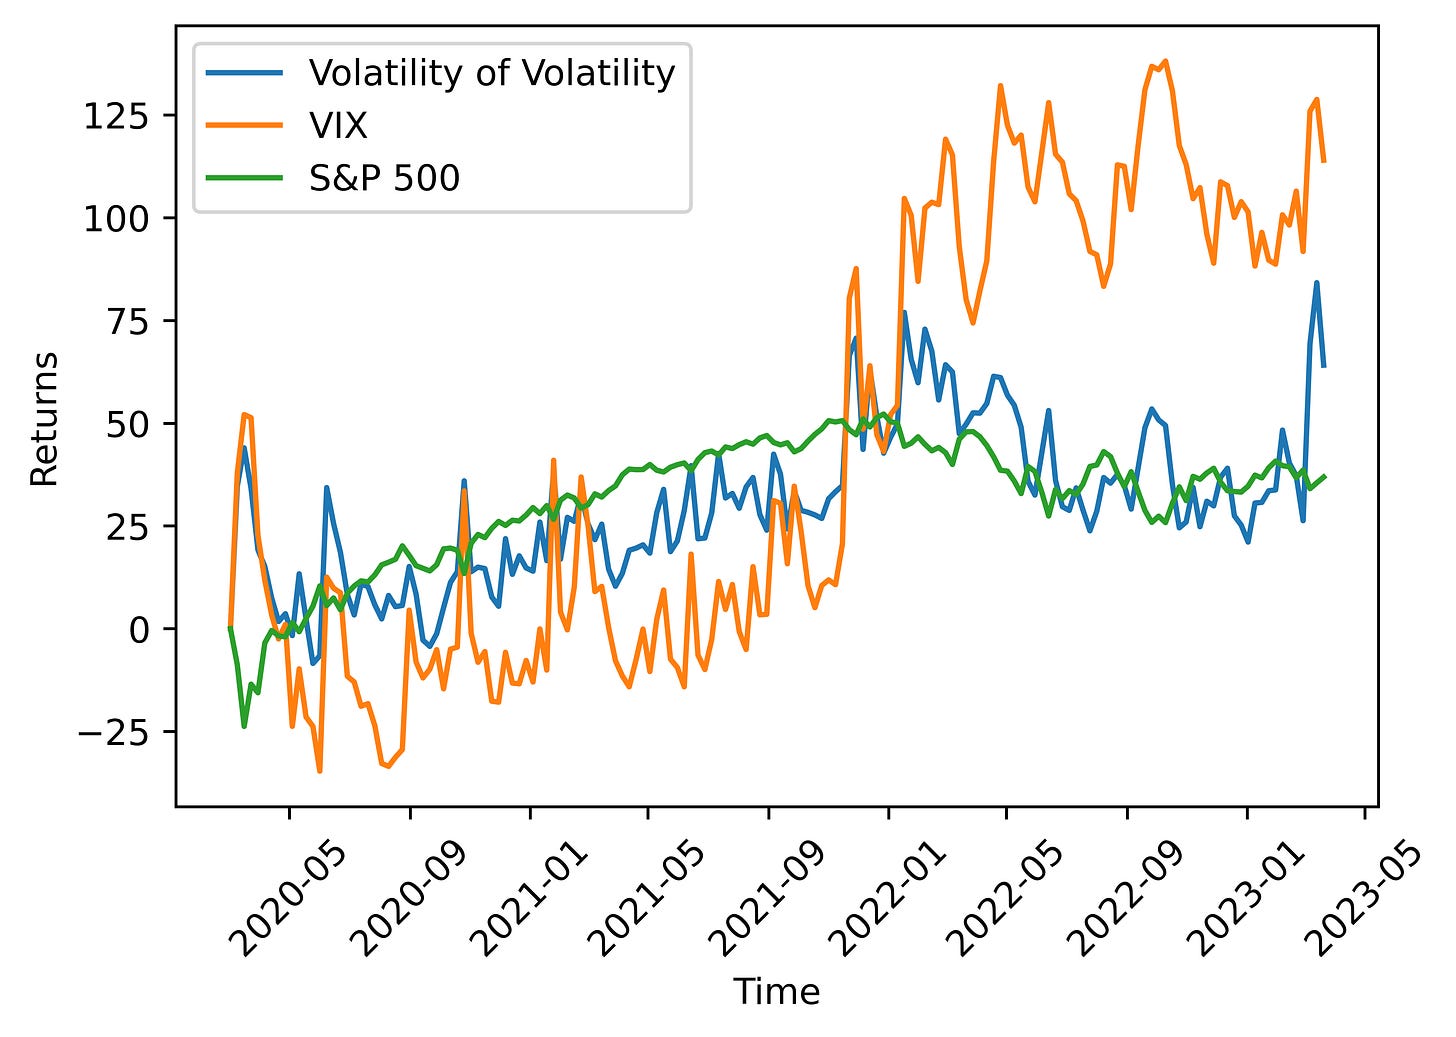
Let’s see what this looks like:
As demonstrated, the spread between the VIX and the “VIX of VIX” tends to be mean-reverting. This makes sense since we know that volatility itself is also mean-reverting. Another relationship that can be observed is that from 2020-2022, it appeared that the VVIX actually led the VIX, as in increases in the VVIX were followed by increases in the VIX days later.
The VVIX Index - Use Cases
To understand a practical application of the VVIX, we must first extract value out of the index value. On Friday, March 24th 2023, the VVIX index closed at 99.72:
Like the VIX, the VVIX index value represents an annualized volatility figure, so based on the closing price, the index assumes “The settlement price of the VIX will move by an annualized 99.72%”. Let’s extract more value from that:
Dividing this by the square root of 252 trading days gives us the implied volatility of the VIX over the course of 1-day. So, based on the most recent closing price, we expect the VIX to move up or down 6.28% in the next trading session (99.72 / sqrt(252)). We can extrapolate this to any number of days out by multiplying that 1 day value by the square root of the number of days we want. So, in this case, we expect the VIX to move up or down by 34.40% over the next 30-days (6.28 * sqrt(30)).
If we have an idea of how much the VIX will move by over a defined period, we can take it a step further and figure out how much the S&P 500 will also move. The VIX estimates the annualized volatility of the S&P 500 index, so we can use the same formula as above to get the estimated volatility for any range of days. On Friday, the VIX closed at 21.74:
This translates to a 1-day volatility of 1.37% for the S&P 500, and a 7.5% 30-day volatility. However, that volatility is based on the current VIX value when we could be using a future VIX value. Thanks to our prior VVIX calculation, we know that the VIX will move by ~35% over the next 30 days, so let’s use that to get a new, future VIX.
This gives us a range of VIX prices from $14.13 to 29.35. When re-extrapolated to the S&P 500, this gives us a 30-day volatility range of 4.87% to 10.13%. So, by using the VIX of VIX, we estimate that over the next 30-days, the S&P 500 will go up or down by 4.87% to 10.13%.
This information provides the foundation for an extraordinarily profitable strategy, which I discussed in great detail here:
Final Thoughts
Understanding and measuring the volatility of volatility, as represented by the VVIX index, can provide valuable insights for investors and traders. By analyzing the VVIX and its relationship with the VIX, we can estimate the future volatility of the S&P 500, allowing for more informed decision-making and the potential for profitable trading strategies.
While this approach isn't foolproof, it does offer an additional tool for those who want to be more proactive in managing risk and optimizing returns.
Happy trading! :)


