

Capturing The Hedging Pressure Effect
The most beautiful letters you'll hear all week? C.O.T.

To understand what this effect is and how it’s captured, we must first understand the data that the strategy will be based on.
Background
The Commitment of Traders (COT) report is a report published every Friday at 2:30 P.M. (CST) that shows the aggregate holdings of different participants in the U.S. futures market. The data is based on the actual commitment of traders on that week’s Tuesday, and is verified on Wednesday before being published. Let’s see what that looks like:
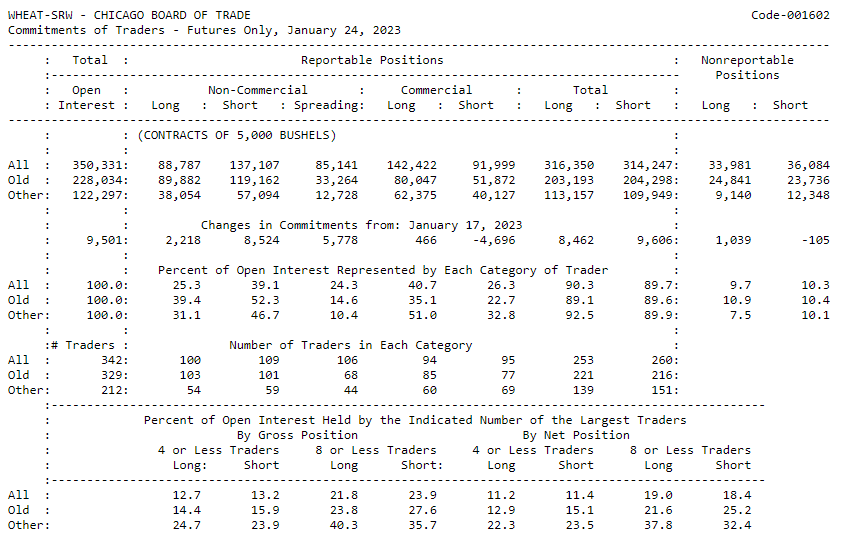
In the legacy report for soft red winter (SRW) wheat, we get to see the positioning of Commercial and non-commercial traders, but just that alone is vague and not-so insightful, so let’s get some more granularity:
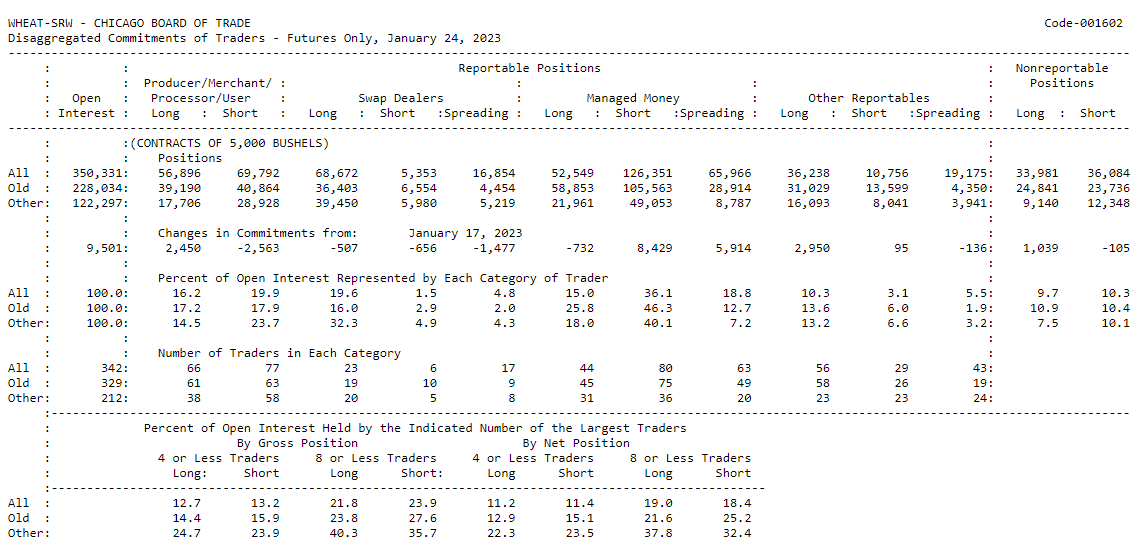
Now we have a breakdown of the positioning and can better see a picture of who’s holding what and what their motivations are. So with that out of the way, let’s dive into the meat of the strategy:
Hedging Pressure Hypothesis
This theory focuses on the relationship between commercial producers and commercial consumers. So, the two main parties are farmers (producers) and food/manufacturing companies (consumers).
Farmers sell futures to hedge against the risk of the price going lower. If they can lock in a rate of $150 for 5,000 bushels of corn, and in 2 weeks the market price drops to $145, the farmer will be happily hedged and will sell for $5 more than the market rate.
Companies generally buy futures to hedge against the risk of the price going higher. A corn starch company can lock in a rate of $150 for 5,000 bushels, and in 2 weeks if the market price rises to $155, they will pay $5 less than the market rate.
These two competing motivations merge and create a net position that will vary by commodity. Here’s a cleaner visual example:
Keep reading with a 7-day free trial
Subscribe to The Quant's Playbook to keep reading this post and get 7 days of free access to the full post archives.