Building a Volatility Trading Empire [Code Included]
It's time for a new challenge.
In recent times, we’ve traveled far and wide through various corners of the market, hunting for additional profits that can be squeezed out. We’ve been able to quantitatively exploit event-driven situations, ml-based alphas, and even some quirky econometric models.
Although we’ve made significant findings, it’s not enough. Outperforming the market by 10x is great and all, but who wants to wait a year to realize those results? We need to be pounding the pavement and making the market write us a hefty check every day. Every day.
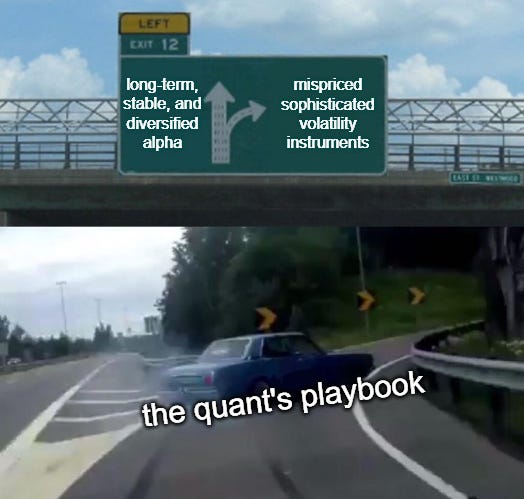
So, with our sights set on this new goal, there’s no better place to look than to our lifelong friend — volatility.
The traditional way of making money daily through options comes from selling volatility, so let’s first start there. Fortunately, we’ve already put in place a jumping off point:
It’s been awhile since we’ve touched on this approach, so let’s take a quick refresher:
The Short Vol Approach
In order to sell short-dated options, we need a gauge of market expectations for volatility. There is no better source of this than the VIX1D index since it is a real-time estimate based on the prices of very short dated SPX options. As we discussed earlier, converting VIX values to daily expectations is pretty easy:
VIX1D = 15 (15% annualized S&P 500 volatility)
15 / 16 (16 is the approximate value of the square root of 252 trading days)
Daily Expected 1 Day Move = 15/16 = 0.9375%
Great, so now we know what the market expects volatility to be over the course of 1 trading day. However, in our approach, we aim to collect the available scraps of premium in the final 2 hours, so we only want to know what the market expects for that sliver of 2 hours. To do this, we should discount the expected move to our trade time. We can go one of two ways:
We can assume that 1 trading day is equal to 7 hours (9am to 4pm), so we multiply the 1 day expected move by 2/7 to get a 2-hour expected move of 0.2625%.
The risk of this is that it will be selling very close to the money and will require us to adjust constantly, potentially hurting profits.
We can multiply the 1 day move by a fixed figure, say, 68%.
This will lower the frequency of us having to hedge, allowing the approach to preserve a necessary high win-rate.
This will also result in lower profits due to the lower premiums offered.
So, each trading day, we discount the expected volatility by 32% and sell an iron condor of strikes outside of that range. We then monitor the realized volatility, and if 85% of our expected volatility gets realized, we cash out before the strikes have a chance of creating losses. For example, if our discounted expected move is now 0.63%, we cash out if the stock moves by >0.54% (.85 *.63).
Let’s see how that approach performed this year:
From April 24th (earliest available VIX1D data from vendor) to October 13th, the approach generated a 31% return at an 82% win rate!
Sounds amazing, right?
Well, let’s take a deeper look into the trade records:
The first thing to notice is that our high win rate is reflected in the size of the premiums offered by the market for accepting this risk. On average, we receive a $7 credit for every $200 of risk for a ~3.5% return. Most retail brokers charge a $0.65-$1.50 per contract commission on opening option trades, so, an iron condor with 4 legs will have an expected cost of around $5. That $5 fee represents 71% of our average profit!
Let’s see the performance including that adjustment:
Not good.
The cut-off threshold of 85% does a great job at limiting the steamroller effect, but because the safe strikes carry such low premiums, slippage and fees are monumental factors in the PnL.
Now, we can try getting around this through higher premium products like the NDX which offer us around $35-$50 on $1,000 of risk, but screw that.
The issue with selling volatility is that it leaves us weak. The central premise of selling vol is choosing the contracts that are least likely to have a high payoff — because of this, market participants will almost always offer us the lowest amount possible for this service. When an adverse move happens, those same market participants will always charge us the highest prices for the service of unloading that risk.
We desperately need to flip the script.
Instead of nibbling on the crumbs our fellow market participants so graciously offer us, we need to be the ones who offer the crumbs and then demand loaves in repayment.
The Dark Side: Reverse Volatility Arbitrage
Before we go further, it’s crucial for us to first build out an economic rationale. If we want to be on the opposite side of volatility, we need to be able to accurately predict and identify when exposure to volatility will payoff and when it won’t.
Keep reading with a 7-day free trial
Subscribe to The Quant's Playbook to keep reading this post and get 7 days of free access to the full post archives.


![Deploying A VIX-Based Volatility Frown System [Code Included]](https://substackcdn.com/image/fetch/$s_!8g9E!,w_140,h_140,c_fill,f_auto,q_auto:good,fl_progressive:steep,g_auto/https%3A%2F%2Fsubstack-post-media.s3.amazonaws.com%2Fpublic%2Fimages%2Fe12a6c58-74c1-4d96-8331-9e694ebed478_850x312.png)


