
A Junior Quant's Guide to Event-Driven Trading
The best model in the world can’t beat having better information. And we have it.


When you see a stock with performance like this:
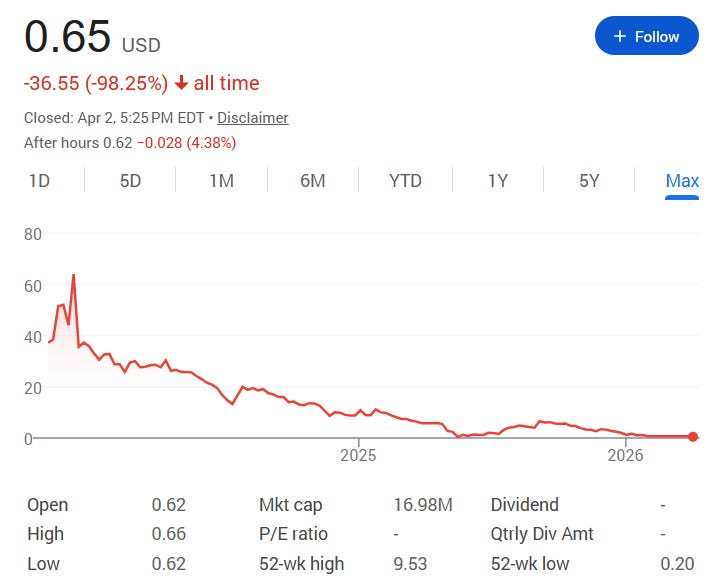
You have to know that it didn’t get that way overnight. And more often than not, it didn’t get that way quietly.
On every step of the way down, companies like this are forced by regulators to publicly share every detail on exactly how business is going and what they’ve got planned.
All you have to do is look for it.
So, that’s exactly what we did.
A Primer on Advanced Event-Driven Trading
For a quantitative trader, you have to know that the “quantitative” part can only go so far.
At the end of the day, markets are driven by information, above all else.
Even for purely quantitative strategies like stat arb, that information component can cloud up returns as it’s really, really hard to hedge against a company that just announced it’s going bankrupt and went down 75% overnight.
By going the event-driven route, you’re still working with data and markets, the only difference is that the event happening is the signal.
Now, none of this might be news to you.
You’re likely already familiar with the most typical market events:
Earnings
Biotech announcements (e.g., FDA drug approvals/rejections)
Fed meetings (e.g., rate cut/hike decisions)
However, this is essentially the tip of the iceberg:
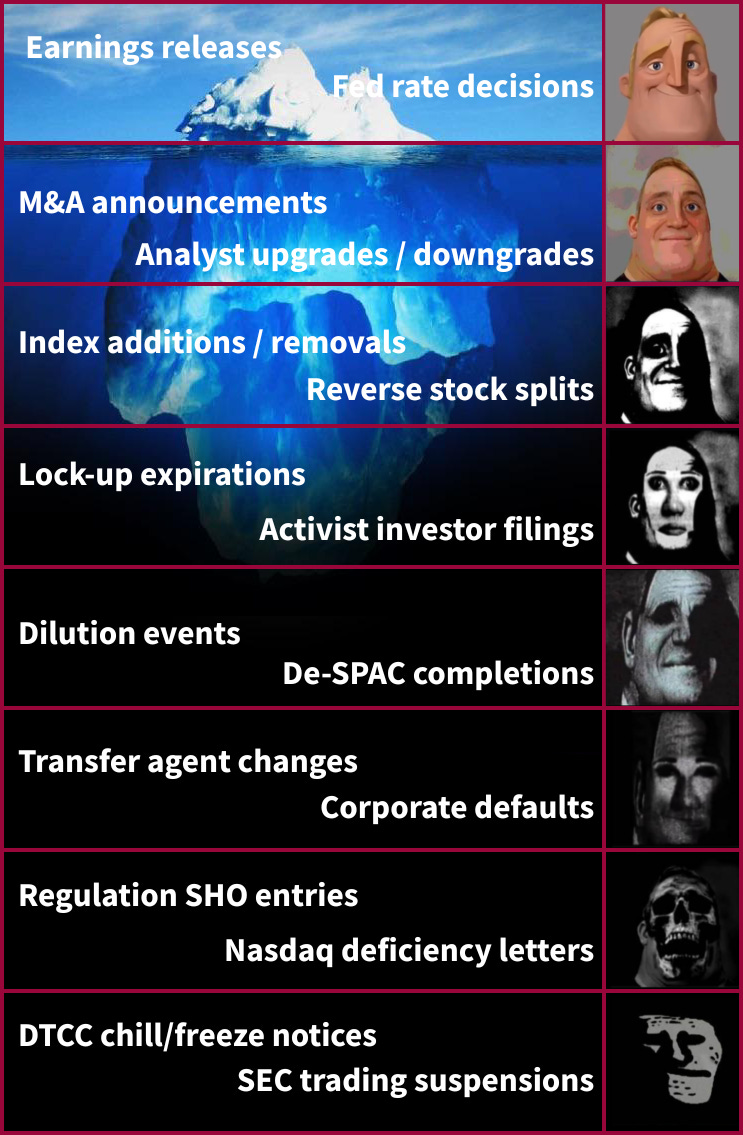
The real edge comes from turning things that happen in the market and making them an event.
To see an example of this, let’s take a look at a understudied, but common market-happening:
Dilution
At a high level, dilution is pretty simple.
A company needs more cash and won’t or can’t take out a loan from the bond market. So, it simply issues new shares and sells them on the open market.
With those proceeds, it can do whatever it pleases; raise exec salary, increase R&D funding, pay off other debts, whatever.
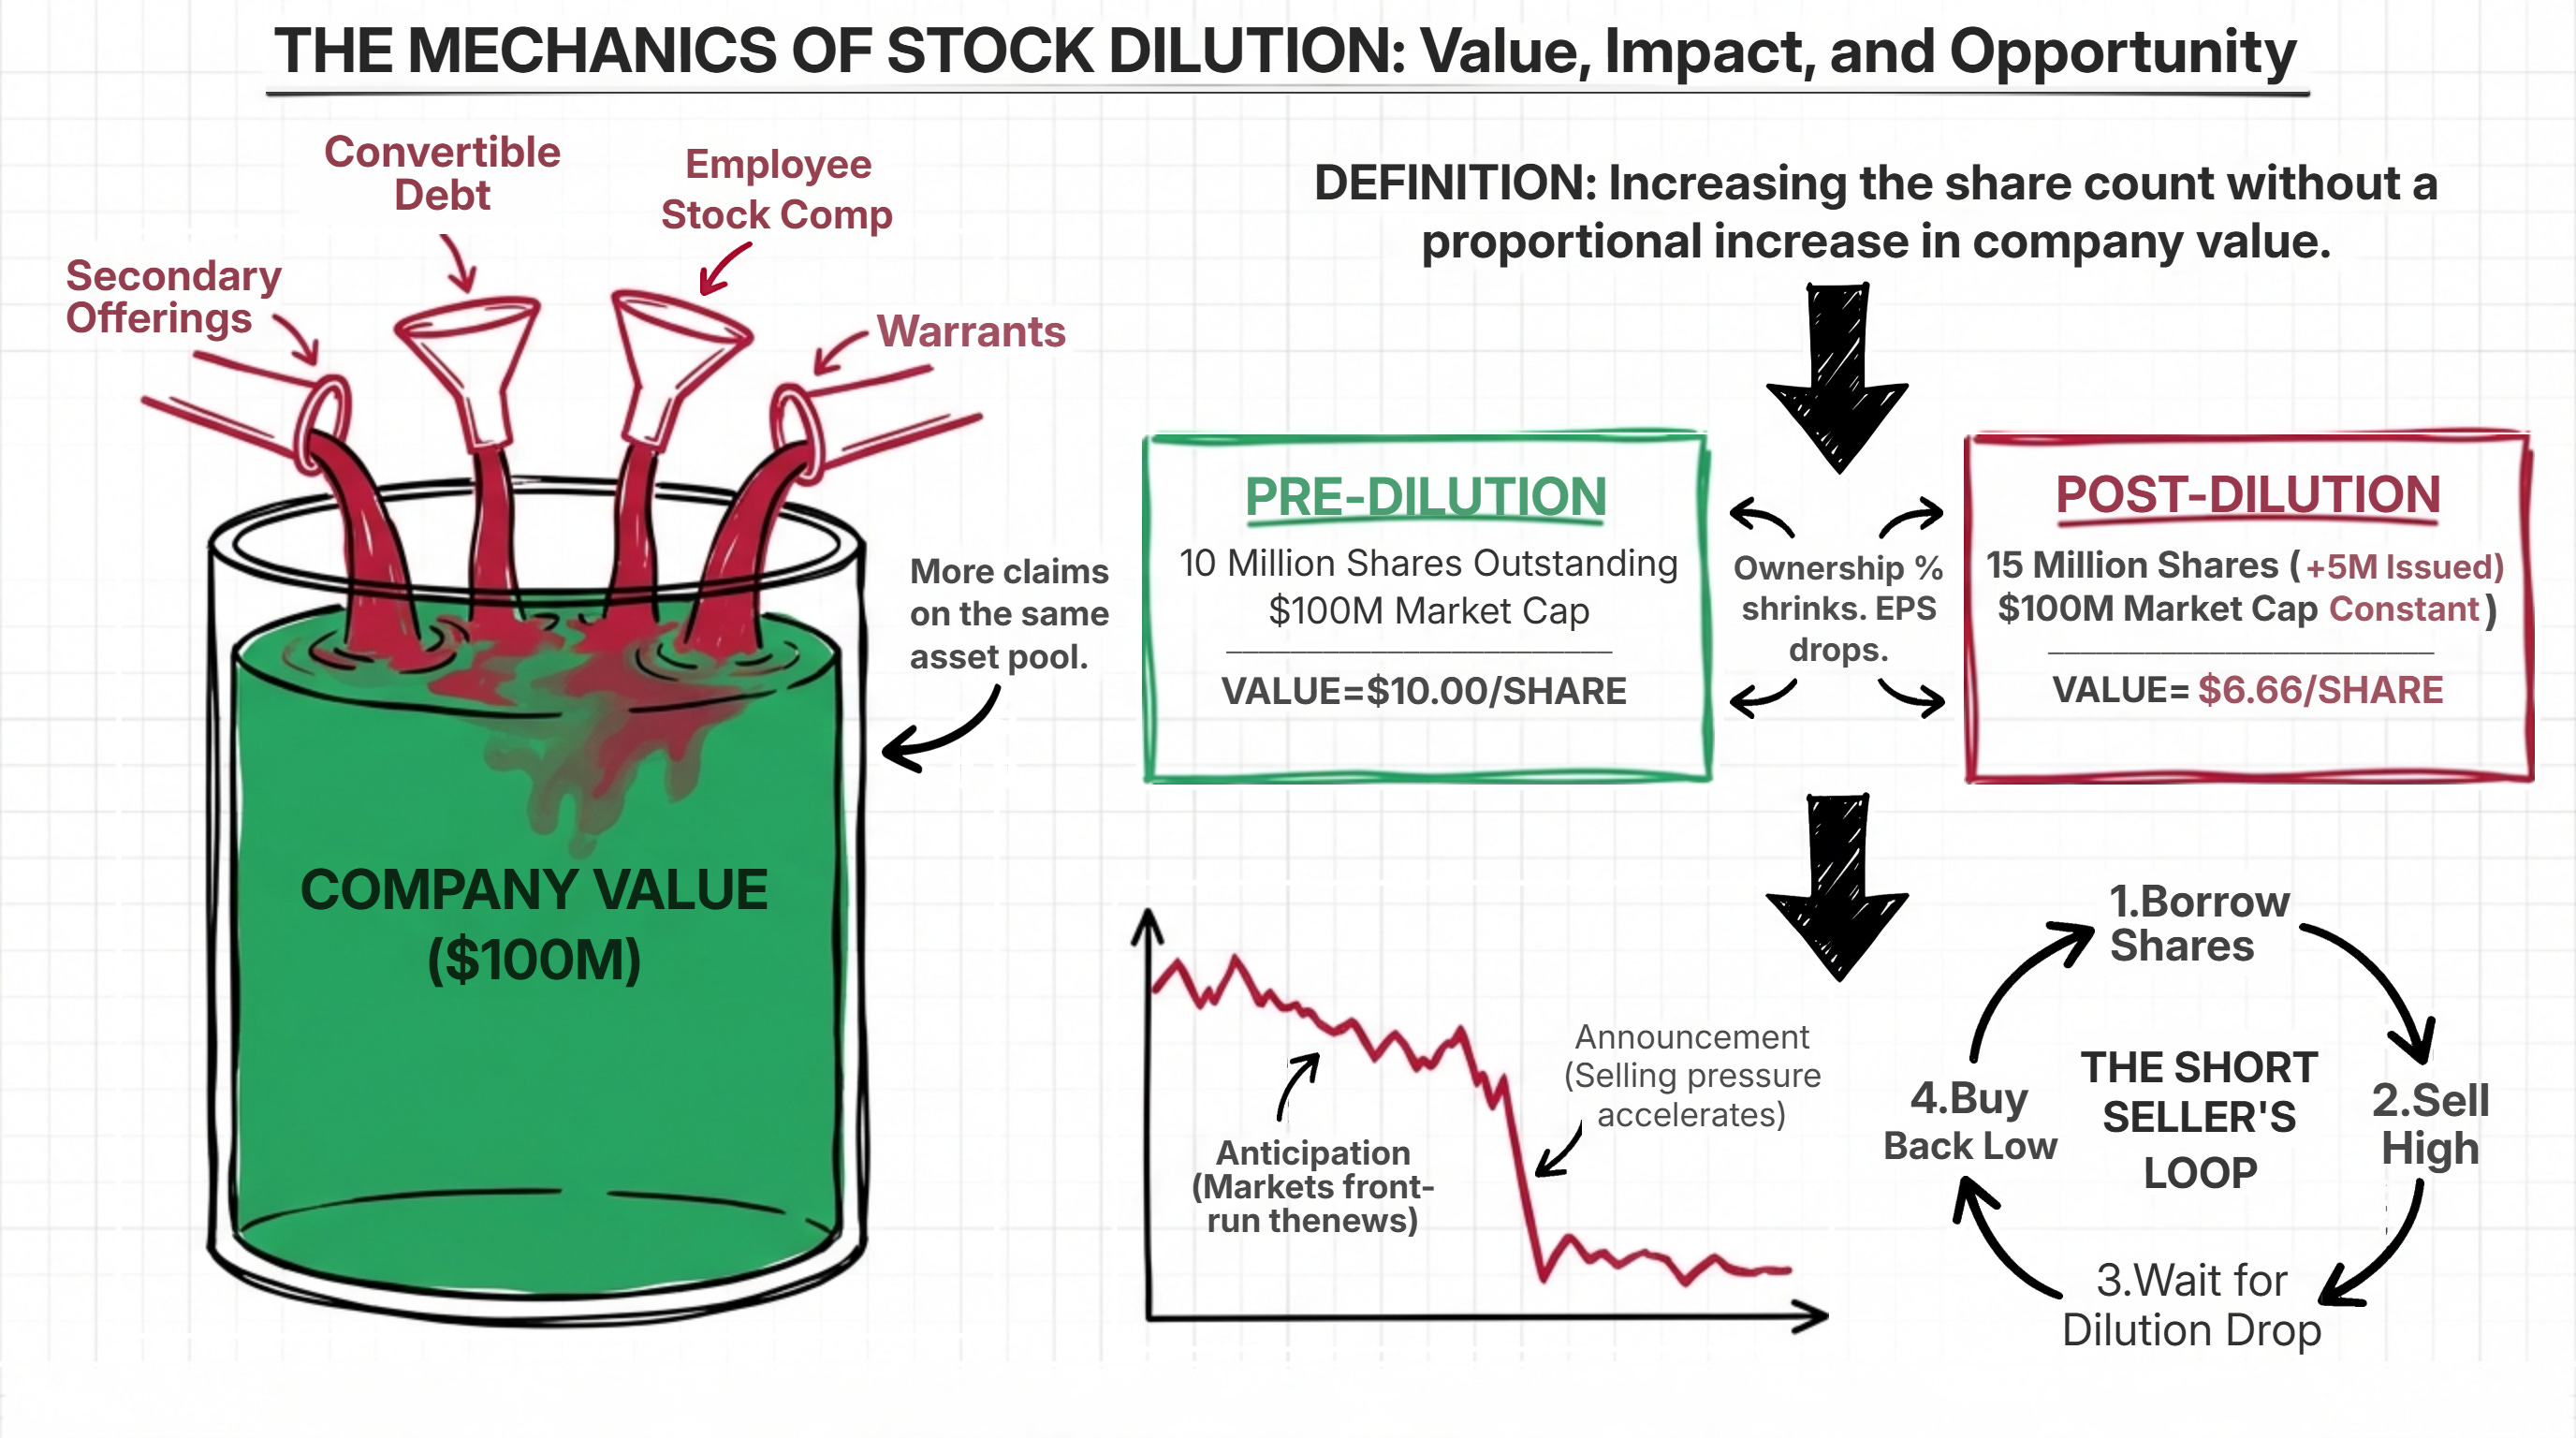
Now, naturally, this isn’t risk-free cash.
If you’re an investor in one of these companies and get told that your 5% stake is now going to be a 3% stake, you’re going to be less-incentivized to hold it, let alone buy more shares.
And you’re not alone; the same dilution happened to the other 3,000 investors and they have the same view too.
When all of those participants have the same view, on the same stock, at the same time, the net result gets pretty predictable:
At this point, you might think to yourself:
“Why not just short companies when they’re diluting their shares?”
Well, you can.
This is the core of the next tranche of event-driven trading:
You take a specific market happening, collect every time it happened, then see what happened after.
If it’s predictable in the way that economically makes sense (i.e., you expect diluted stocks to go down), you dive deeper and see if it can be a real return stream.
So, let’s do exactly that.
The Event IS the Trade
Okay, so we know that certain events lead to certain outcomes, so before building out the strategy, let’s map out which events we want to focus on:
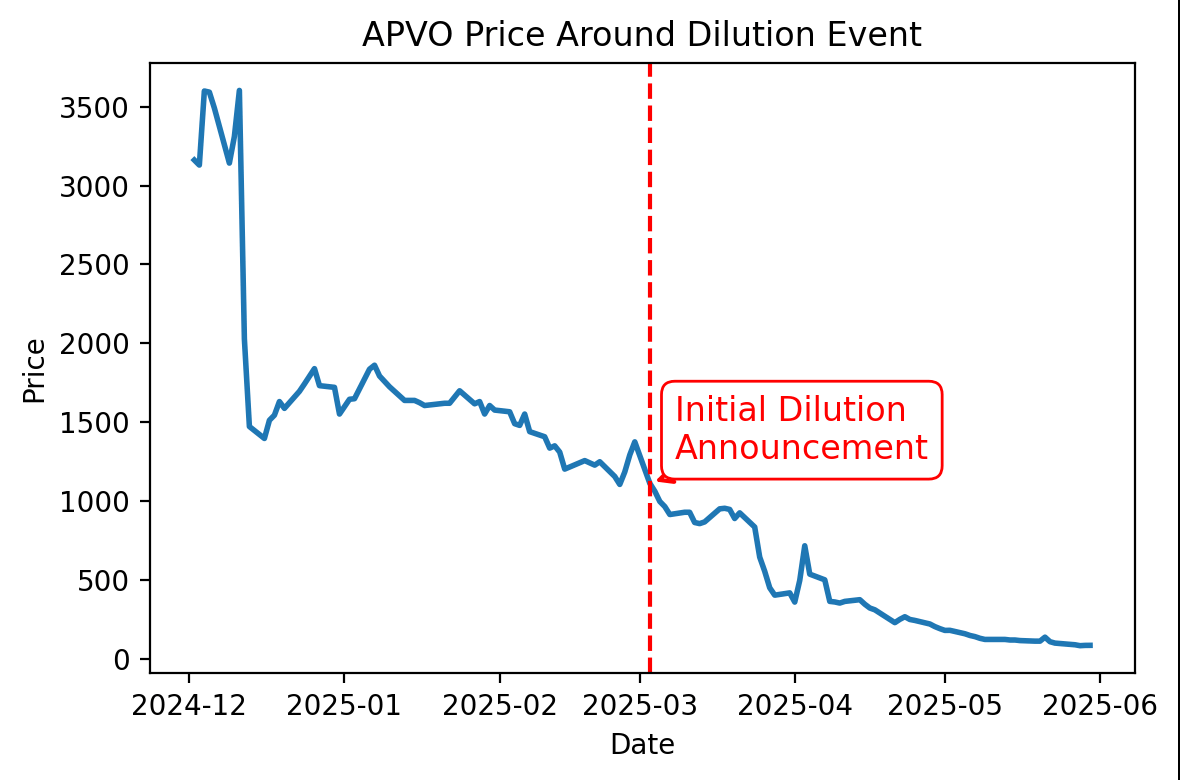
Dilution
Company issues new shares, existing holders get diluted, selling pressure follows.
De-SPACs
A blank check company closes its merger and becomes a real company. The thing is, most of these companies went the SPAC route because they couldn’t IPO the traditional way. So, you’re already starting with an adversely selected pool. From there, it’s a mess of redemptions, float confusion, and brutal valuation discovery. The cohort underperformance is well-documented.
Defaults
Company misses a debt payment, gets delisted, or enters bankruptcy proceedings. By the time this happens, the stock is usually already in freefall, but the event itself tends to accelerate the final leg down.
Once we have them all ordered by date and time, we then want to see what happens if we outright short them for a month.
Now, before moving further, we have to address a very important stage of where event-driven modeling goes wrong: lookahead bias.
Although you can know about the event as soon as it happens, it is very risky to assume that you can or would have traded it exactly when it happened.
If you model on the basis that you traded right as the event happened, it often makes returns look much better than they actually were.
So, going back to the strategy; we’re going to add a full day delay between when the event was logged and the time of trading.
If we got word of the event on Jan 1 at 10 am, we place a trade on Jan 2 at 4 pm.
This comes with drawbacks of its own, but it at least gives us a more realistic baseline that would match practical trade execution.
So, with our strategy and universe defined, let’s run a few mock simulations:
Keep reading with a 7-day free trial
Subscribe to The Quant's Playbook to keep reading this post and get 7 days of free access to the full post archives.
 | A guest post by
|