

A Junior Quant's Guide to Alternative Data
Forget about the satellite images, here's what actually works.

Let’s say there was a really big test coming up and passing it meant that you would materially upgrade your life, but failing it meant tangible repercussions that could hurt you.
Naturally, you’d either:
A) Get really good at the subject to make sure you pass.
or
B) Figure out a way to get the answers in advance.
In many ways, this test metaphor describes the day-to-day incentives of market participants around the globe.
However, in markets, “skill” is relatively hard to define/prove. But more often than not, if you simply have the information before the other party does, you end up the winner.
Upon realizing this, you begin to enter the murkier world of alternative data.
Information, Information, Information.
Now, alt data is as simple as the name suggests; it’s data, but just not your typical stock prices and earnings calendars.
To see this, let’s say you wanted to get an edge on Chipotle’s next earnings report.
Yes, things like forward guidance and expectations have a large impact on how price moves after a report, but at root, you just need to answer the question of: “How many burritos did Chipotle sell this quarter?”.
So, you get creative:
In 10 major metro areas, you go to each Chipotle location and set up Raspberry Pi devices to listen to the requests phones broadcast when scanning for nearby Wi-Fi networks.
When someone’s phone nearby pings it, it gets logged along with a timestamp and a unique ID.
Each night, all unique visits and IDs are pushed to your central database at home.
From this, you now have a real-time approximation of exactly how many people visited a Chipotle location on a given date.
Naturally, this isn’t perfect. A handful of users will repeatedly ping and overstate the real traffic, there are thousands more stores not in your sample, some devices will be stolen/removed, and so on.
But nevertheless, it’s a good start, and with some more work, it can stabilize and turn into a legitimate informational advantage.
That’s the big picture of what alternative data really is:
having a question → being crafty about how to get the answer → putting on a market view
This premise was extremely interesting to us, so we thought for a long time on how we could do something similar ourselves.
Most of what we found was:
ToS breaking (many platforms really don’t like you scraping their data)
Restrictive (hard-to-access anonymized credit card transaction data)
Legally-grey (an apparent thin line between research and corporate espionage)
However, we kept at it and actually found something that we’ll probably regret showing publicly.
Boring, But Predictive.
Our core research question was simple:
“On any given day, how many people showed interest in this specific stock?”
We didn’t want trade volume data as it’s often after-the-fact, but instead something that reflected the human behavior someone would take before making the decision to place a trade.
We first tried to crack this in a few ways: web search traffic data was spotty as Google doesn’t outright show it, website traffic data isn’t public, and the SEC stopped updating their filing traffic logs.
But eventually, we settled on something we didn’t expect:
Okay, okay, that doesn’t sound too exciting at first, but bear with us.
Wikipedia page views are exactly what they sound like: the number of times a given Wikipedia page was viewed on a given day (bot-filtered). The data is free, public, goes back a decade, and gets updated daily.
Our initial thinking was that when a participant is considering a serious investment in a stock, they want to look it up first. Yes, many institutional parties go straight to a 10-K, but for a major chunk, it’s Google first, then the first link, which is often the Wikipedia page.
So, if we were able to know the exact number of people doing that process, the exact historical numbers to compare outliers to, and with a coverage of every company with a page; then surely, there must be a way to trade it.
Putting It To Work
The simplest way to use this is in a simple long-short approach between competitors.
If there is more demand for company A than for equivalent company B, you buy company A and short company B for market neutrality.
Lever it up, then you’re in the hall-of-fame.
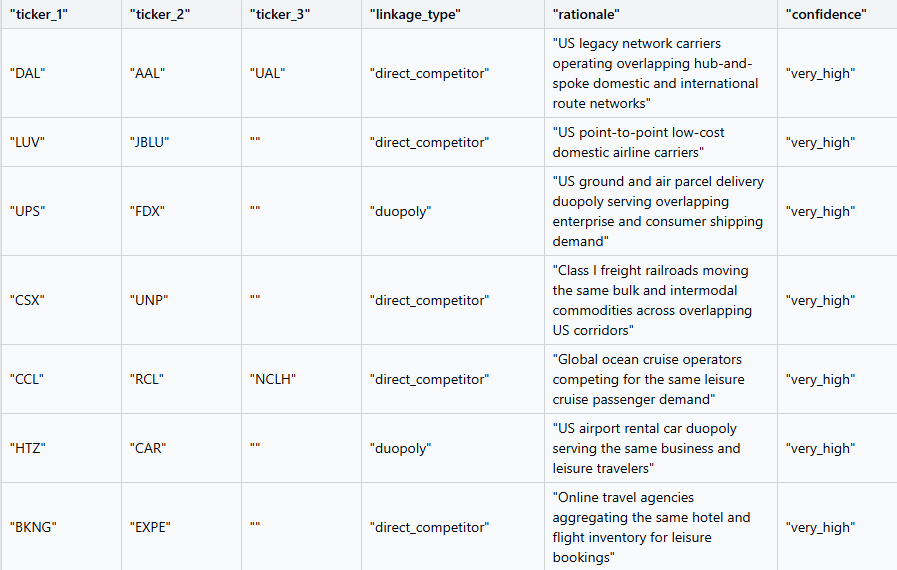
To test this out, we wanted to make sure there was no risk of flukes, so first, we pulled every company in our liquid, optionable universe and asked for some help from a buddy you just might be familiar with:

After some manual intervention, we were able to start off with a suitable universe of genuinely related stocks:
From here, we wanted to see if we could predict the better performing company exclusively using the page views data. So, if company A had more page views in the last 30 days than company B, we bet that it’ll outperform it in the next 30 days.
Starting at a high level:

From our sample of 47 pairs, we found that the stock with the higher 30-day average of Wikipedia page views tended to outperform its direct competitor about 58% of the time. 39 of those 47 pairs (82%) had hit rates above the 50% null, so this isn’t being driven by a few outlier pairs carrying the average.
To look deeper, let’s isolate a sample: Delta (DAL) and American Airlines (AAL).
Both are major US carriers that fly overlapping routes, face the same fuel costs, the same labor dynamics, the same TSA headlines, etc. On most days, the flows are pretty in-line with each other:
As demonstrated, when one receives a bump in page views, so does the other, which makes sense. If there’s some interest around Delta, there’s likely to be some follow-up interest in its direct competitor.
But what might be even more interesting is what happens when there’s a divergence:
If Company A suddenly gets a 3-standard deviation boost in page views, but equivalent company B didn’t, is it generally predictive of future price movement?
To test this, we can create a simple strategy:
For every fundamentally linked pair, track the rolling 30-day difference in page views and its standard deviation.
When that difference spikes by 3+ standard deviations on a given day, flag the ticker with the surge in attention.
Buy it at the next session’s close (a 1-day lag, so we’re only trading on data we’d actually have in hand).
Hold that new position for 1 trading week.
Repeat.
Let’s see how that performed:
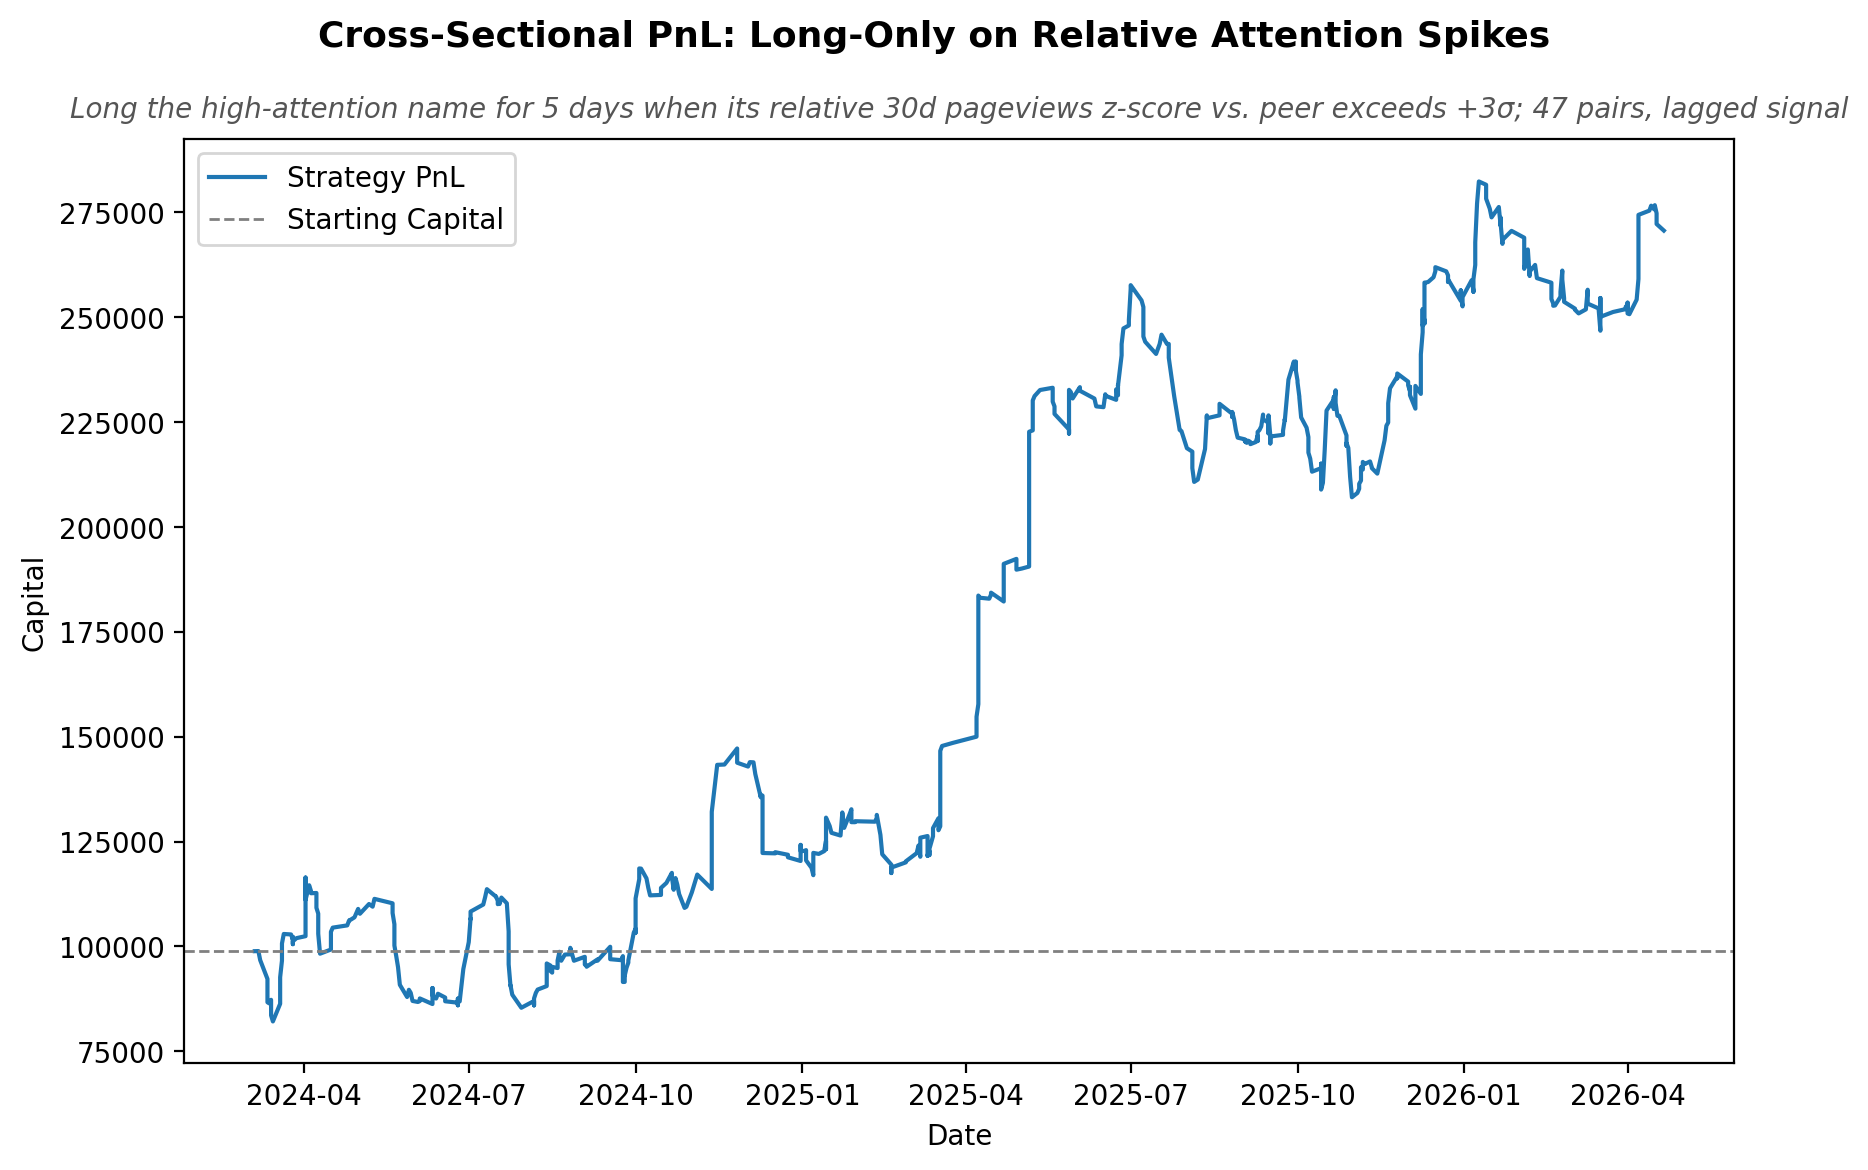
Across the full sample, the average success rate was about 53%, but the wins were disproportionately large. When the signal worked, it tended to really work, which is what gives the equity curve its staircase shape.
Remember, this is the most basic expression of the signal. No filtering by sector, no position sizing by z-score magnitude, no overlay with price momentum or earnings windows. Just: "did attention diverge sharply, and if so, lean into it."
Even at this level of crudeness, the edge is visible. The version we run internally is several layers more sophisticated than what we showed today, and the dataset itself opens up a much wider research surface than just pairs trading.
The Stuff We Didn’t Talk About
Keep reading with a 7-day free trial
Subscribe to The Quant's Playbook to keep reading this post and get 7 days of free access to the full post archives.