

A Common Sense Guide to Volatility Trading [Code Included]
Everyone knows vol comes back down. This is, oddly, why selling it is so hard.


It’s a Tuesday morning, you pull up a name you’ve been watching, and its 30-day implied vol is printing 48, sitting right near the top of where it’s traded all year.
Vol is mean-reverting, everyone knows that, so you do the obvious thing.
You sell the straddle, perhaps even an iron condor.
Two days later, the print is 61, the short is deep underwater, and the reversion you were promised is nowhere to be found.
The position eventually comes back, mostly, after a week of you not sleeping.
So, what went wrong?
Well, nothing, really.
You were right that vol mean-reverts, but more often than not, you’re looking at the trees while ignoring the forest.
A single implied vol number, on its own, tells you almost nothing about whether you should be selling it, buying it, or staying away. To actually trade the reversion, you need three things you can’t read off that one print, and getting all three is what separates collecting premium from donating it.
So today we’re going to walk through what those three things are, why each one is its own leg, and how stacking them turns a coin-flip into a genuine edge.
The numbers in here are all real, pulled straight from the Alphanume API across a rotating basket of the most liquid optionable names. As usual, the code will be available below for you to verify and replicate yourself.
With that said, let’s get right into it.
Vol Mean Reverts? No-Duh.
Mean reversion in implied vol is one of the most reliable regularities in all of markets:
Vol spikes on fear → bleeds back as the fear fades
It’s so dependable that the entire short-vol complex, every iron condor seller and every overwriter on Fin-Twit, is at root just a bet that today’s elevated vol comes back down tomorrow.
And because it’s so well known, the instinct is to treat it as free money:
See high vol, sell it.
See low vol, buy it.
Collect the difference.
However, where most go wrong is just taking that vol number, say an implied volatility of 48%, and just automatically bucketing it as high/rich.
For a sleepy regional utility, a 48 vol is a five-alarm fire. For a small biotech walking into a data readout, it’s cheap.
The number means nothing until you anchor it to something, and “I have a feeling this is elevated” is usually not what professional option traders go for first.
So, the real question splits into three:
Is the vol actually expensive, meaning are you being paid to sell it relative to what the stock is really doing?
Is it expensive for this specific name, stretched far up in its own trailing range, or just normal-for-it?
How stable is the vol itself, so you know whether the reversion comes back as a gentle drift or a knife fight?
Expensive Compared to What?
There are two completely different meanings of “expensive vol,” and conflating them is where a lot of the damage starts.
The first is expensive relative to realized:
This is the classical volatility risk premium; the gap between what options are pricing (implied vol) and what the stock is actually delivering (realized vol). The clean way to see it is the ratio
implied_vol / historical_vol.When 30-day implied sits above 30-day realized, the ratio runs above 1, and you’re being paid more in premium than the stock has been moving. That’s the crux of the IV/HV Premium feed: per name, per day, implied vs realized as both a spread and a ratio, ranked across the whole universe.
The second meaning is expensive relative to its own history:
A 48 vol that lives in the 95th percentile of a name’s trailing history is a very different animal from a 48 vol that’s been the floor all year.
That’s IV/HV Rank: it drops today’s implied (and realized) into the name’s own trailing 52-week band, as a 0-to-100 rank. The same vol print can be a screaming sell on one ticker and a yawn on another, and the only way to know which is to score it against itself.
Now, the reason any of this matters is that the reversion is genuinely strong when you measure from the rank.
We bucketed every stock in our universe by its IV rank and looked at what its 30-day implied did over the following month. The pattern is about as clean as anything you’ll see in markets:
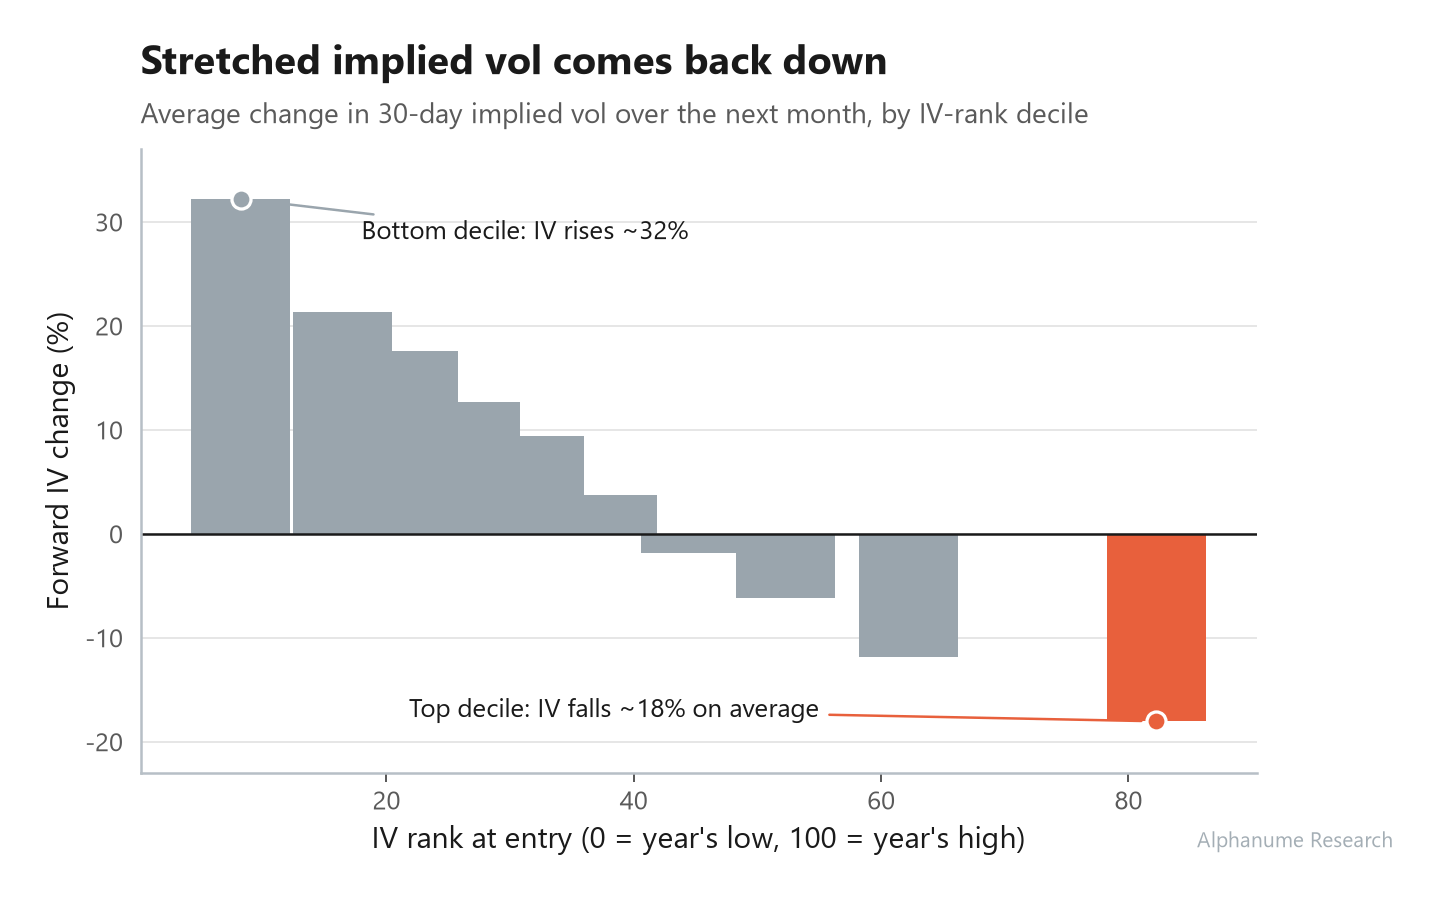
Names entering the top decile of their own IV range saw implied vol fall about -18% over the next month, on average. Names in the bottom decile saw it climb about +32%. Additionally, the relationship in-between is almost linear the whole way down.
The higher the rank, the harder the reversion pulls.
This is the signal under everyone’s intuition, made measurable.
Now, as much as the ratio matters for identifying rich/cheap options, it’s just as useful for sizing the edge. When we line up that same forward reversion by IV/HV ratio, selling vol where the ratio is below 1 actually bled as the cheap names kept drifting higher.
The seller’s edge only switches on above a ratio of 1, and at the richest end, around 1.5x, the short captured roughly 7 vol points of reversion. In other words, the profitability of selling options goes up substantially with how wide the gap between implied vol and realized is.
Sell It Like You Mean It
Put the two together and the hunch becomes a robust screen. The flagship version of this is the conditioned premium sell, and it runs in five steps:
Pull the universe from IV/HV Premium for the day, settled rows only (
only_final=true), so you’re not trading off a provisional intraday print.Demand the vol be rich, filtering to the top of the IV/HV ratio distribution (
min_ratio_rank=1.25or higher). This is the “am I actually being paid” gate.Demand it be stretched, joining in IV Rank and keeping only names high in their own trailing band (
min_iv_rank=70). This is the “is the reversion likely” arm.Structure the short as a strangle or an iron condor around the at-the-money implied range, sized to the move the chain is implying rather than to your conviction.
Harvest the reversion over the following weeks as the rich, stretched vol does what rich, stretched vol does.
The difference between running this screen and just selling whatever looks high isn’t just theoretical either. We measured the vol points captured shorting 30-day vol and holding a month, sliced by how you screen:
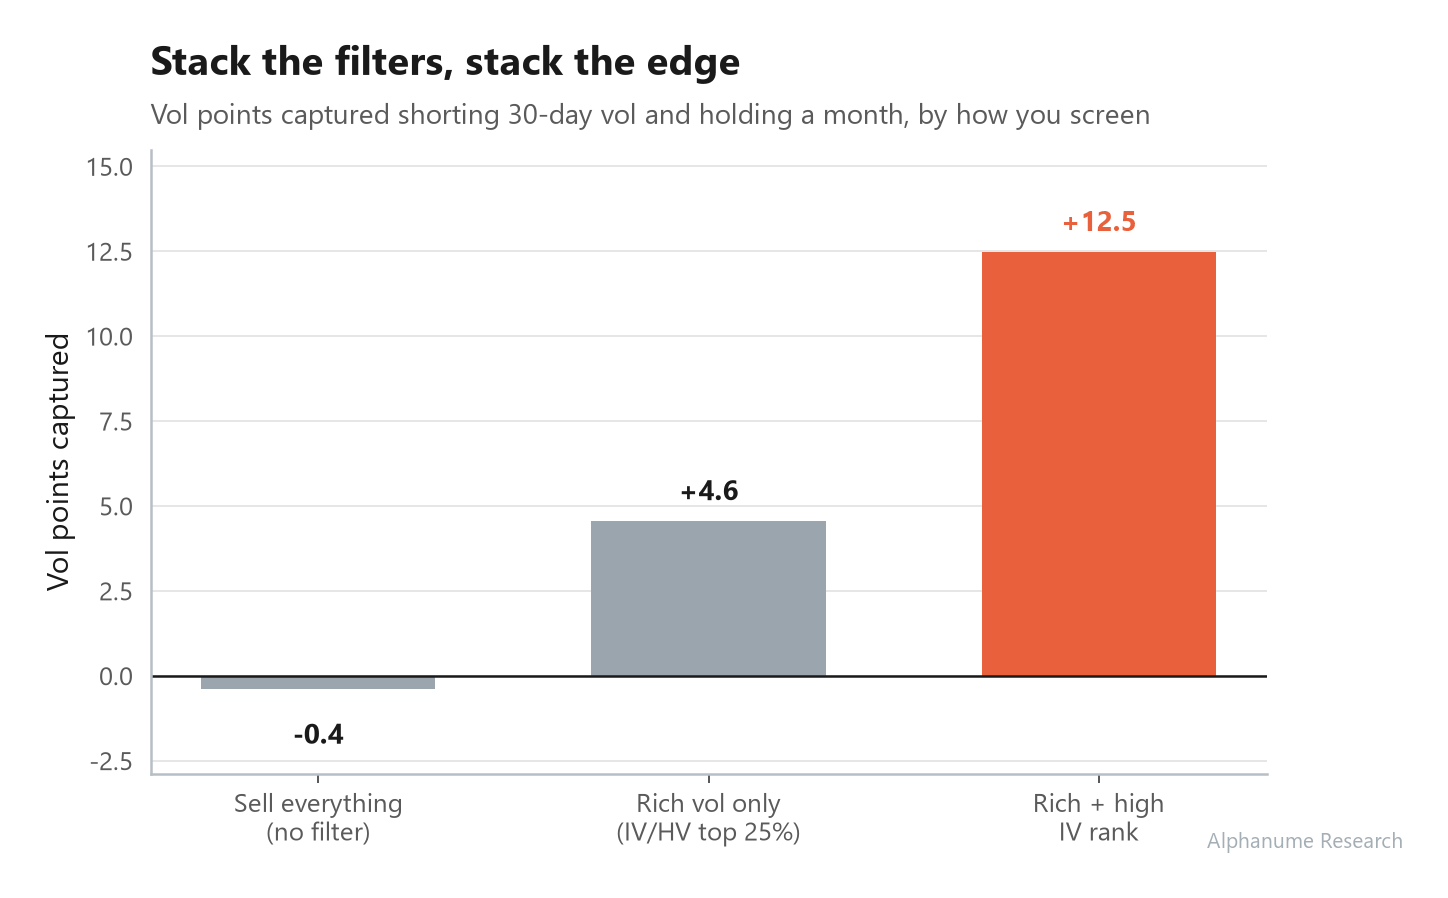
Selling everything indiscriminately captured basically nothing, a hair below zero. A true coin-flip, which is exactly what naive premium-selling has felt like for the last two years.
Filter to only the rich names and the captured edge jumps to about 4.6 vol points. Stack the high-IV-rank condition on top of that and it roughly triples, to 12.5 vol points. Each filter is a number from one of these feeds, and each one stacks.
This is the whole pitch, honestly. The general mechanism of selling high implied vol was never a secret or proprietary. What you couldn’t do without the data is condition the trade tightly enough to be on the right side of it.
Now, you can grab a free key and pull every one of these fields yourself in about two minutes.
Think You Know Vol?
There’s a third number, and it answers a question the first two can’t: once you’re in, how violent is the ride?
That’s Vol-of-Vol. It measures the instability of a name’s vol itself:
A low reading means the vol is well-behaved and grinds around a level.
A high reading means the vol is whipping around, lurching between regimes.
We took the exact same short strategy from above (the rich and high-rank names you’d actually trade) and split it by vol-of-vol:
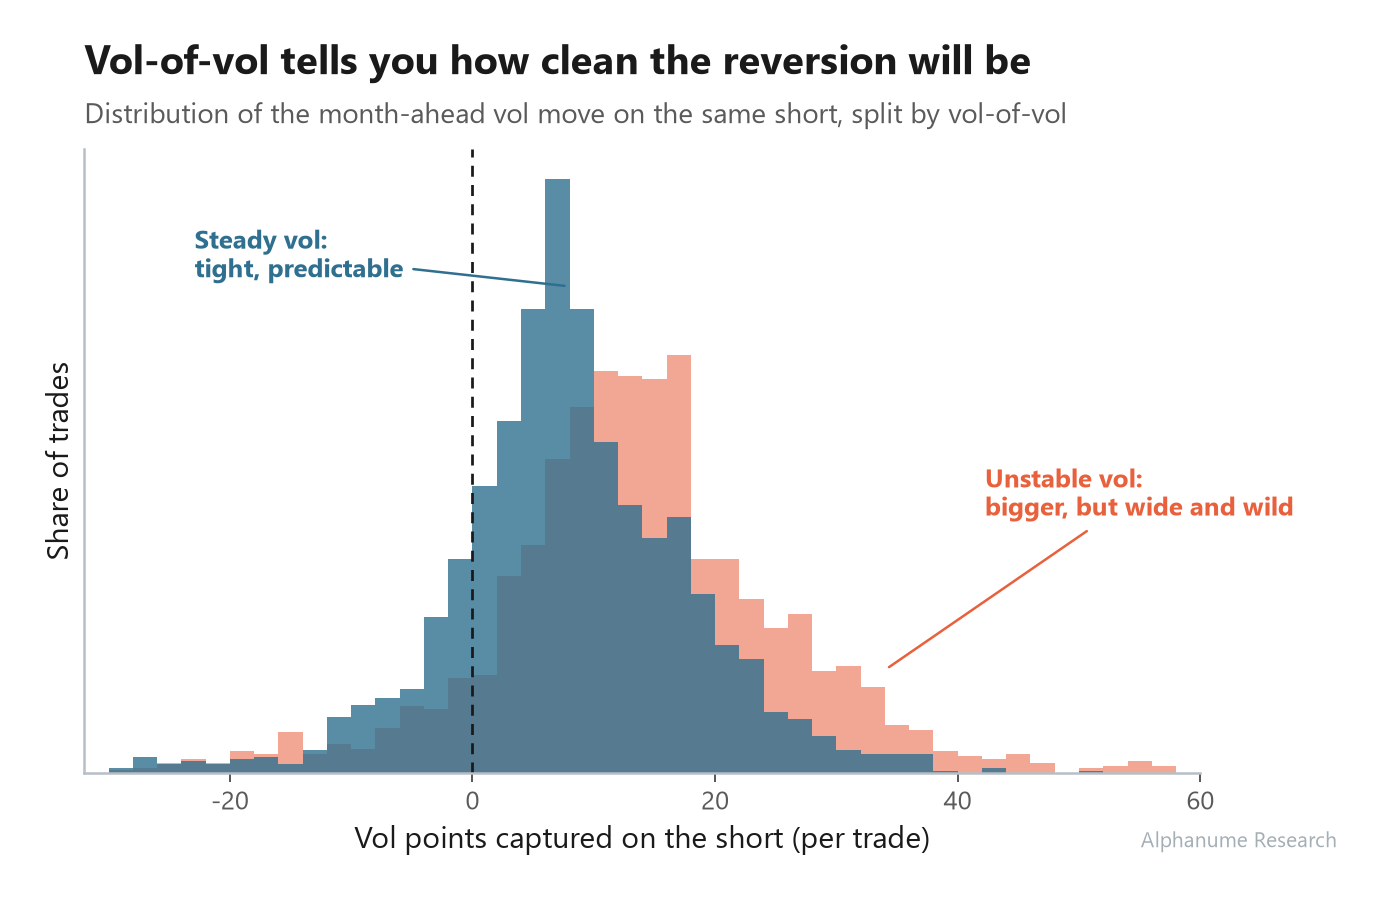
The steady-vol names gave a tight, predictable distribution, clustered around a modest win, hitting in roughly 83% of cases.
The unstable-vol names captured more on average, the reversions were bigger, and they actually won more often, north of 90%. They also came with a much wider, wilder spread of outcomes, stretched well out to the right.
So, vol-of-vol can be thought of as a sort of sizing dial that lets you know what kind of trade you’re signing up for:
Low vol-of-vol is where you fish for steady, theta-like income. Smaller reversions, but you can size them up and sleep through them.
High vol-of-vol is where the big snapbacks live, because the vol got violently stretched to begin with. They pay more and hit more often, but they’ll also hand you a stomach-churning week or two before they resolve. Size those down.
There’s More Than Shorting Vol
When the subject of trading vol comes up, it almost always skews to selling and collecting premiums. However, if you flip every sign from above, the same machinery points you at vol to buy.
When a name sits in the bottom decile of its IV rank, that same reversion math says its implied vol rises about 32% over the following month. That’s the classic long-gamma setup where vol is cheap relative to its own history, and the pull is upward more often than not.
The pluckier version pairs IV rank against HV rank:
When implied is scraping the bottom of its range while realized is already starting to creep up above it, you’re looking at a name whose options are priced for calm that the stock has quietly stopped delivering.
Long the straddle, or long whatever gives you the cleanest gamma, and let the implied catch up to the realized that’s already moving.
A note on method. These are real pulls. They are not a turnkey backtest. The reversion we’re measuring is a mark-to-market on the vol itself over a one-month forward window. The realized path and execution costs are all live risks that sit on top of the vol move, and the vol-of-vol section is exactly about respecting the first of those. The point here is the proper filtering and the demonstration that these three numbers move the odds in a measurable, stackable way. What you build on top of that is the fun part.
Final Thoughts
Everyone already knows that vol mean-reverts, but that knowledge, on its own, is worth almost nothing, which is why so many people sell “high” vol and still manage to lose.
The edge is knowing, before you commit a dollar, whether the vol is genuinely rich, whether it’s stretched far enough in its own range to snap back, and how rough the trip will be when it does.
Those are three questions, and now they’re three numbers: IV/HV Premium, IV/HV Rank, and the Vol-of-Vol Index. All three are free for exploration on the Alphanume API, updated daily, across the full optionable universe, with a real-time intraday layer when you want it. And if you'd rather not write any code, they're all live on the new dashboard too, just input a few filters and click around.
If you’ve ever sold a straddle on a feeling and watched it gap against you, you already know exactly what these are worth.
Code
As promised, the code for each experiment covered in this post can be found in the Alphanume Strategy Lab on GitHub, under the Stock Volatility Trading folder.
A quick guide on getting you started:
Each script is standalone. Pick the one you want, run it top to bottom, and it prints a table and saves the chart you saw earlier in the post. Nothing to wire together, no project to set up.
Three steps to get the first one running:
Clone the repo, or just download the single file you care about. None of them depend on each other.
Install the libraries with
pip install -r requirements.txt. It’s the usual suspects: requests, pandas, numpy, matplotlib.Drop in your key. Near the top of every file there’s an
API_KEY = "alp_your_key_here"line. Paste your own key in and you’re done. If you don’t have one yet, a free key takes about a minute at alphanume.com.
Then, just run it.
Here’s what each one does:
iv_rank_mean_reversion.pypulls the IV/HV Rank feed, sorts every name-day into IV-rank deciles, and measures what implied vol did over the following month. This is the chart where stretched vol bleeds back down.stacked_filter_edge.pylayers the screens one at a time, sell everything, then rich vol only, then rich and high-rank, and prints the vol points captured under each. This is the ladder that climbs from a coin-flip to a real edge.vol_of_vol_ride_quality.pytakes that fully-screened short and splits it by vol-of-vol, so you can see the steady reversions and the wild ones side by side.
As always, thank you for reading, and we hope to see you in the next one.